 Michael O’Higgins placed his stamp on the investment world with his 1991 publication of the book “Beating the Dow”. In the book he details a strategy he calls the High-Yield 10 which buys the 10 highest yielding Dow Jones Industrial Average Stocks – out of a potential 30 – and rebalances yearly. The strategy was labeled the “Dogs of the Dow” by Barrons (that’s my roommate’s dog “Boondock” to the left). While O’Higgins may not have been the first to come up with the strategy – John Slatter mentions it is his 1991 book “Safe Investing: How to Make Money Without Losing Your Shirt ” – O’Higgins generally gets most of the recognition for popularizing it. (Indeed, an article by H.G. Schneider published in the June 1951 Journal of Finance documents a strategy of investing in low P/E Dow stocks). O’Higgins also details a subset of the Dogs – the five lowest priced of the 10 highest yielding – that he calls the Flying Five.
How have these strategies performed? According to performance figures on O’Higgins website here, since 1973 the returns have been:
DJIA 11.21%
Dogs 14.63%
Flying Five 17.11%
Very strong outperformance (James O’Shaughnessy documents the performance back to 1929 at ~ 14%). An equity curve is below: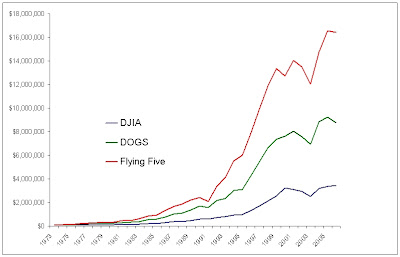
One of the problems with quantitative analysis is mining the past data to optimize the results. A way to avoid this no-no is to use in and out of sample data. A good way to determine if O’Higgins strategies have merit is to test their performance after the publication date (1991).
Below is a table of returns from 1973 – 1991, and post-publication returns from 1992 – 2005. As you can see, the returns after publication have been in line with the Dow.

During the in-sample period the DOGS beat the DJIA in 74% of the years vs. only 36% of the years since 1992. The Flying Five outperformed the DJIA in 79% of the years in-sample vs. only 50% out of sample. Is O’Higgins guilty of optimization? Or is it simply the result of too much money chasing after the strategy? After all, there is a “Dogs of the Dow” closed end fund as well as a number of mutual funds that follow the Dogs strategy. At one time Merrill had a unit trust named the Select-10 with over $10B AUM. It is difficult to come to a conclusion, but the evidence so far is mixed.
The Summer 1997 FAJ published a paper titled, “Does the “Dow-10 Investment Strategy” Beat the Dow Statistically and Economically?”. McQueen et al examine the results from 1946-1995, and find that the Dogs outperform by roughly 300 bps, with slightly higher volatility. However, the authors suggest most of the outperformance would have gone to transaction costs and the IRS, and the strategy went decades underperforming as well. Their conclusion was that an investor would have been better off in the Dow-30.
I am not even going to get to the Motley Fool Foolish Four strategy – if you want more info on that one you can read this paper, “Mining Fools Gold” (albeit a good discussion of data mining).
One last ranking system is labeled the Darlings of the Dow, and formulated by Larry Williams. The criteria is detailed in his book “The Right Stock at The Right Time” published in 2003. Basically, it adds a value slant to picking the Dow stocks, which at least has a fundamental basis behind it. He then overlays the best six months of the year on top of his value filters. His “hard” rules (he uses a combination of them in his newsletter so it is a bit difficult to compare the historical returns vs. out-of-sample returns, although the out-of-sample have been strong) are to buy 5 Dow stocks on October 19th and hold for 6months. He chooses the five based on a combination of P/S, P/E, Earnings growth, and P/Cash Flow.
For those of you who want to follow the Dogs and Flying Five strategies, the picks for 2007 are below:
DOGS can be tracked at Stockpikr here (although an astute investor would pick the closed-end fund DSF which is trading at a 6% discount) :
(in descending order of yield)
PFE
VZ
T
MO
C
MRK
GM
DD
GE
JPM
Flying Five can be tracked here:
PFE
VZ
GM
GE
T
O’Higgins, who has been managing money since 1971 and started his own firm in 1978, followed up his first book with a second in 1999 titled “Beating the Dow with Bonds“. He presents a second strategy which chooses one asset class yearly from US Stocks (the Flying Five strategy), T-Bills, and Zero-Coupon Long Bonds.
Unlike the Dogs and Flying Five strategies, BTDWB has a number of rules:
1. At the start of the year, check the S&P500 Earning Yield (reverse of PE or 1/PE) and compare it with the 10-Year US Government Bond.
2. If S&P500 Earning Yield is greater than the 10 Years Government Bond plus a margin (0.3%), then Stock’s valuations are compelling compared to Bonds. Invest in Stocks: use the Flying Five strategy.
3. If S&P500 Earning Yield is lower than the 10 Years Government Bond plus a margin (0.3%), then Stock’s valuations are not compelling compared to Bonds. Invest in Bonds.
4. If you Invest in Bonds, check the price of Gold versus 1 year ago. If Gold price increased versus 1 year ago, then invest in Short Term Bonds: use 1 year Treasury Bills. If Gold price decreased versus 1 year ago, then invest in Long Term Bonds: use 30 years Bonds (preferably Zero Coupon).
Since 1973, this strategy would have returned 20.4% per annum vs. the 11.21% for the DJIA. What about since publication? Since 2000, the DJIA has returned 1.82% per annum vs. 6.01% per year for BTDWB. The good news is that it largely avoided the bear market of 2000-2003. The bad news is the performance was 15% lower than the average. Will the system continue to outperform in the future? The question really being asked here is, “Will the future look like the past?” I personally would not invest in this strategy (seems like too much data mining), and O’Higgins clients also have to overcome a 3% management fee hurdle, ouch.
If anyone has a suggestion for a resource for historical Zero Coupon Long Bonds, please email me.
