Are hedge funds returning great performance, or is it merely an illusion and they’re selling world betas in disguise?
Having examined how the timing model holds up against the Harvard and Yale endowments, how would it compare to the other brightest minds(and highest paid)in the room? In an earlier post, I examined the structure and characteristics of hedge fund databases and indices. Although the study is dated, here is a link that reveals that only 3% of hedge funds are represented in the 5 major databases.
Below, I am going to examine how a simple buy and hold asset allocation(labeled AA) and our timing model compare to the hedge fund indices. With the understanding that the hedge fund indices returns will likely be overstated, I present the year-by-year results of the timing strategy vs. the HFRI and HFR FOF indices (HFR is the longest time series available). For an apples-to-apples comparison, we have omitted any management fees to invest in either the hedge fund indices (index provider fees) or the timing models (ETF, mutual fund fees). Both should be on the order of 20 to 100 basis points.
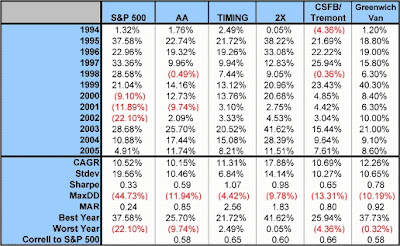
Interestingly enough, even without making any adjustments for survivorship biases, the buy-and-hold asset allocation is nearly identical to the FOF Index across all measures except for correlation to the S&P 500. The timing model beats both buy-and-hold and the FOF Index with a higher CAGR, and lower volatility, drawdown, and worst year.
The 2X levered model likewise compares very favorably with the HFR Index, with slightly higher CAGR, higher volatility, and lower drawdown. Even more intriguing is that all of the strategies come incredibly close to the same number of positive months
The chart below depicts the equity curves of the two timing models, the two hedge fund indices, and the S&P 500.
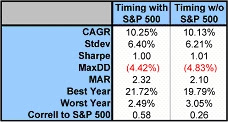
The timing models yearly correlations of returns are in the .50-.60 range, while the FOF index is .34, and the HFRI is .63. This makes intuitive sense because the timing model includes the S&P 500 as a 25% component of the portfolio. Removing the S&P 500 and equal-weighting the four remaining indices results in near identical risk and return figures with a drop in correlation to .26. The table below presents this evidence.
The CSFB/Tremont Hedge Fund Index is asset-weighted, and all funds must have a minimum of $50 million in assets under management, a minimum one-year track record, and current audited financial statements. There are approximately 900 funds in the index, no FOFs are included, and performance is net of all fees.
The Greenwich-Van Global Hedge Fund Index includes approximately 2000 funds that must have a minimum one-year audited track record, open to new investment, a minimum of $20 in assets, and a US dollar share class must be available.
A simple buy-and-hold of diverse asset classes would have produced near identical results as the CSFB/Tremont hedge fund index, although lagging the Van Index in CAGR. The results of the timing model were superior in every measure of risk and return versus the CSFB-TASS Index. The timing model outperformed the Van Index on a risk-adjusted but not on an absolute basis.
Similar performance without all the headaches of wondering if your manager is boarding a plane to Costa Rica with your cash. . .Not to mention lockups, liquidity risk managment, or transparency problems. . .
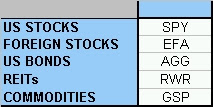
Example ETFs of asset classes mentioned in the article are:


