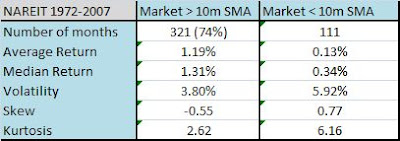
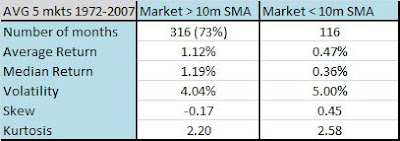
The first version of my paper had a lot more statistics in it. (And a lot less readers. Something about talking about the third and fourth moments of a distribution just doesn’t get people too excited. Mark Shore has a great paper here – Skewing Your Diversification.) The other day I posted about how the best and the worst days in the market tend to “cluster”.
You could spend a lot of time studying vol clustering, and there are fancy models called funny names like ARCH (autoregressive conditional heteroskedasticity)that attempt to describe the process.
Let’s look at the data and see what it could tell us.
Since 1951, the market (S&P500) has been above the 200 day moving average roughly 70% of the time. Roughly 70% of the best and worst days (as measured by 10 and 100 best/worst days) occurred when the market was below the 200 day moving average. The more interesting stat?
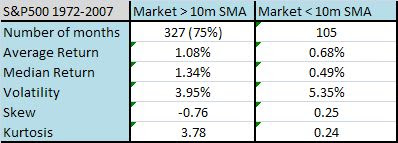
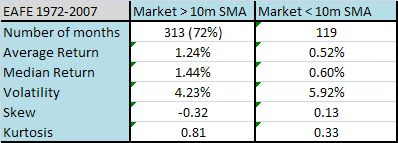
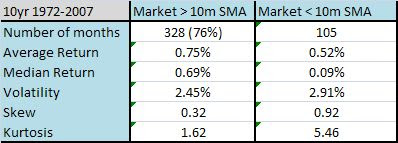
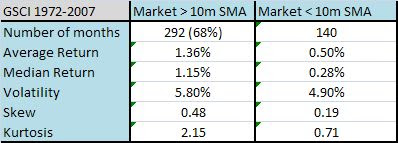
The market is roughly 50% more volatile when below the 200d sma. I touched on this topic in my paper where using the simple timing model works because it basically changes the distribution of returns. You miss the worst days, but also miss the best days. Here are some summary tables for daily returns since 1951, monthly since 1900, and monthly returns for 5 asset classes since 1972.


