Maybe the market is trying to tell you something – if you just listened?
I have written about this subject a number of times. For background you can check out some earlier posts:
Time to Put Money to Work
Mean Reversion After Bad Months
When is the Time to Buy Homebuilders?
When to Buy Japan?
Idiocracy and Mean Reversion
In one study I examined asset class performance after a really bad month.
The take-aways from this study were:
– It does not pay to buy an asset class after a really bad month for the following 1 month.
– 12 Months later the return is not much different than average.
– 3 and 6 month returns, however, are stronger. You pick up on average about 3-4% abnormal returns buying after a terrible month.
A simple strategy would be:
After an asset class has a terrible month (ie MSCI EAFE in January), wait a month then take a 2 month position. i.e. buy March 1 with a two month hold.
It looks like a good "trigger" for equity like asset classes is around -9%, and for bonds around -3%.
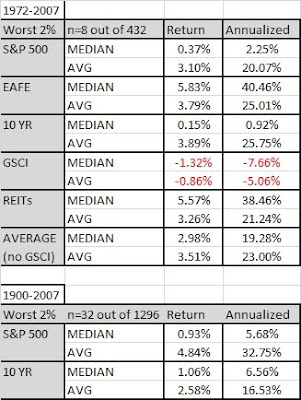
Below is a summary chart of this strategy for the five asset classes I mentioned in my paper. The returns are simply the excess returns (nets out the average monthly return over the entire time period) to a strategy of buying an asset class a month after a really bad month, with a two month hold.
Note that this does not work for the commodity index, and one could speculate that is due to differing risk premiums and sources of return to that asset class. This system would have triggered for REITs after a horrible June (-11.25%). To illustrate, one would wait a month then buy the index August 1.
I imagine if you broke out the asset classes into further subdivisions (sectors, countries, etc.), the same principles would apply but the triggers would widen due to the increases in volatility.


