I have written about the topic of volatility clustering a number of times, and thought I would update the post here. Many people trot out the highly misleading statistic about missing the best 10 days as a reason excuse for buy and hold investing. It drives me crazy to the point I have considered writing a paper on the topic. Great background reading here from Gire and Estrada. Stay tuned.
However, this line of reasoning is way too simplistic. The basic math shows that the vast majority of up AND down days occur when the market has already been declining. The simple reason? The market is more volatile. The last eight months have been a perfect example. I updated the post I wrote back in titled "Dow 300 Point Days and Volatility Clustering". An older post here – "More on Volatility Clustering".
Below I take Yahoo DJIA data back to 1929 and the key takeaways are:
1. The market goes up two-thirds of the time.
2. All of the stock market return occurs when the market is already uptrending.
3. The volatility is 80% higher when the market is declining.
4. Roughly 75% of all of the best AND worst days occur when the market is already declining. Reason: see #3.
5. The reason markets are more volatile when declining is because investors use a different part of their brain when losing money. Reminds me of the behavioral reasons listed by Lo in this earlier video.
.jpg)
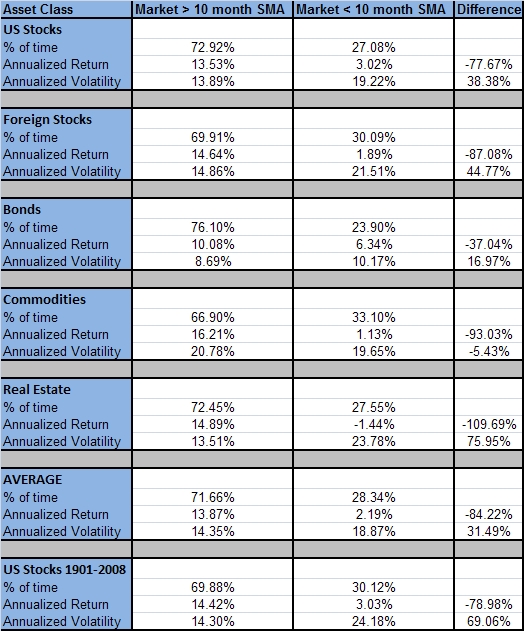
Below is a chart from my book with monthly data on a few other asset classes.