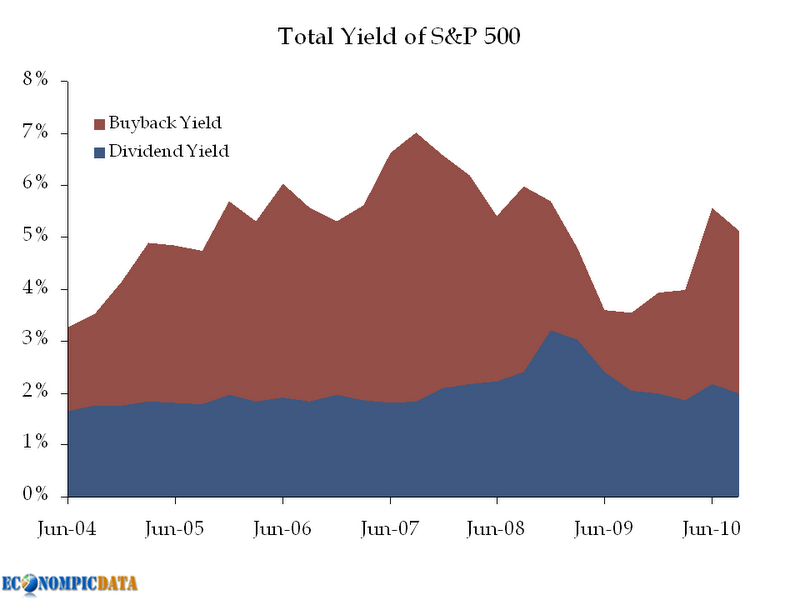
I’ve long written on the blog that dividends no longer give an investor the total picture regarding how companies return cash to shareholders. Dividends quit being predictive in the early 1980’s due to a structural change in markets as companies starting buying back more stock. It is due primarily to the SEC instituting rule 10b-18 in 1982 – providing a safe harbor for firms conducting repurchases from stock manipulation charges. See Grullon and Michaely [2002] for more info on the impact of Rule 10b-18. Nice graphic from EconomPic here:
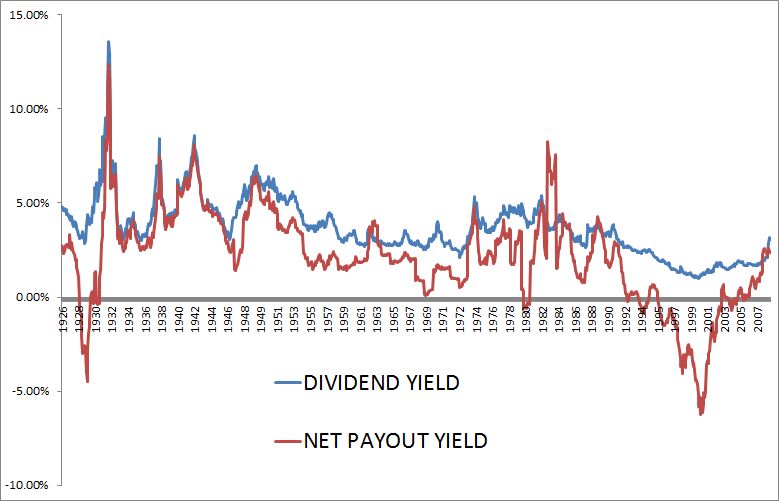
The problem is even including buybacks doesn’t give one the entire picture. You have to include share issuance as well. One of my favorite papers is On the Importance of Measuring Payout Yield: Implications for Empirical Asset Pricing. Take a look at the below chart that shows net payout yield (which is dividends + buybacks – issuance). I think there is a lot of interesting work to be done with float on both an aggregate stock market level as well as individual stock level. (Caveat: one difficulty is that companies can announce buybacks then never make them as well as cutting dividends etc. One could get even further and include debt repayment as well.)
The authors find that “the widely documented decline in the predictive power of dividends for excess stock returns is due largely to the omission of alternative channels by which firms distribute and receive cash from shareholdlers.” Additionally, while dividend yield has lost its predictive ability over time, the payout yield has remained a robust indicator for excess stock return. Many companies still love just talking about dividends, after all it is a great story. But when there is a shift in markets structurally I tend to side with ol John Maynard “when the facts change I change my mind – what do you do?” line of thinking.
From 1983 – 2003 the various strategies returned:
Dow: 13.4%
DOGS: 16.2%
NPY: 19.1%
This paper (“Asset Growth and the Cross-Section of Stock Returns” by Schill, Gulen, and Cooper) is even more encompassing. It basically says a decrease in total assets is good – things like dividends, buybacks, spinoffs, and paying down debt. Ominous signs for future stock performance – accquistions, share issuances, borrowing, and sitting on lots of cash.
I would curious to hear any creative ways readers can interpret the below data sets (and if you have access to CRSP would love to see the paper updated with 2009-2011 data). Would also like to see an indepedent Net Payout Yield “Dogs of the Dow” and “Dogs of the S&P500” with data through 2011. Drop me a line if you are interested in working on either project.
As an aside, TrimTabs does a lot of work here and is launching a tactical fund based on float. Full disclosure: we launched a fund with the same provider (AdvisorShares) and I may be biased since I went to the 2003 ALCS with TrimTabs in Al Davis’s box where Damon had the collision in CF. As an aside to that aside, Davis’s box is the most 70’s pimped out thing I have ever seen with mirrors everywhere, etc.
Here are a couple posts from Aswath Damodaran on the subject of augmented dividends:
Stock Buybacks: What is happening and why?
Buybacks and Stock Prices: Good or bad news?
The Shift to Buybacks: Implications for investors
The below chart and table I constructed from the CRSP Excel files from Payout and Net Payout Time Series Data: Excel File
From Michael Roberts’s homepage:
Payout and Net Payout Time Series Data:
This dataset contains annual and monthly time series for aggregate corporate payout (dividends plus equity repurchases) and net payout (dividends plus equity repurchases less equity issuances). To use this datasets, please reference the following paper which contains details on the construction and usage of the data.
“On the Importance of Measuring Payout Yield: Implications for Empirical Asset Pricing,” with Jacob Boudoukh, Roni Michaely, and Matthew Richardson, Journal of Finance, 2007, 62, 877 – 915


