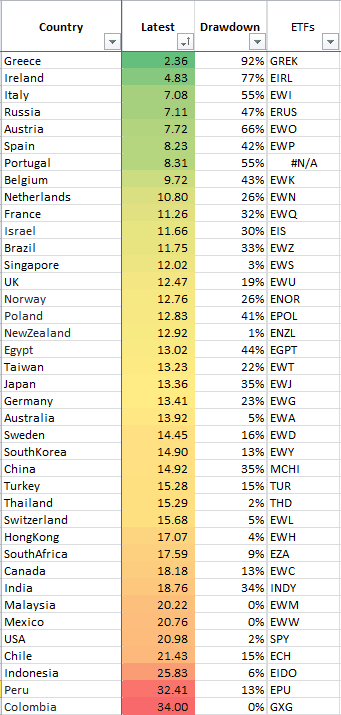
As a follow up to our valuation work, this is a fun table of countries and their CAPE values as well as current drawdowns (total returns).
Not surprising if you’ve read our last few blogs, but low value correlates highly to high drawdowns for the most part. ie the average drawdown for CAPE values:
less than 10: -60%
10 to 15: -25%
>15: -8%
Typically, over time, value is rewarded.
Those that are on my professional mailing list will realize we have incorporated some value metrics into our global tactical models as well as new stand alone portfolios.
Values are from 10/31/2012.
We added a column of representative ETFs but please realize the ETF listed may not correspond directly to the indexes we used. Also note I own many ETFs in our funds and accounts.
Enjoy!


