Below we have updated our 2006 white paper. While you can download the full 70+ page paper here, I’ve also chopped it up into a series of more digestible posts for the blog.
—-
While investors have benefited from strong equity markets in 2012 with the S&P 500 up approximately 16%, the new millennium has been challenging for most investors.
US stocks have returned a meager 1.65% per year from 2000 – 2012, and factoring in inflation, have returned -0.76% per year. That is, if the investors had the ability to sit through two gut-wrenching bear markets with declines of over 45%, and according to recent DALBAR studies, many have not. The average equity investor underperformed the S&P 500 by 7.85% in 2011, and underperformed the index by 4.32% over the past 20 years. (Bond investors are equally as bad.)
One of the reasons for the subpar returns is simple – valuations started the 2000s at extreme levels. The ten-year cyclically adjusted price-to-earnings ratio (CAPE) reached a level of 45 in December 1999, the highest level ever recorded in the US. (We examine approximately 40 global stock markets and how to use global CAPEs in our paper “Global Value: Building Trading Models with the 10 Year CAPE”.)
Figure 1 – Ten-Year Cyclically Adjusted Price-To-Earnings Ratio (CAPE), 1881-2011
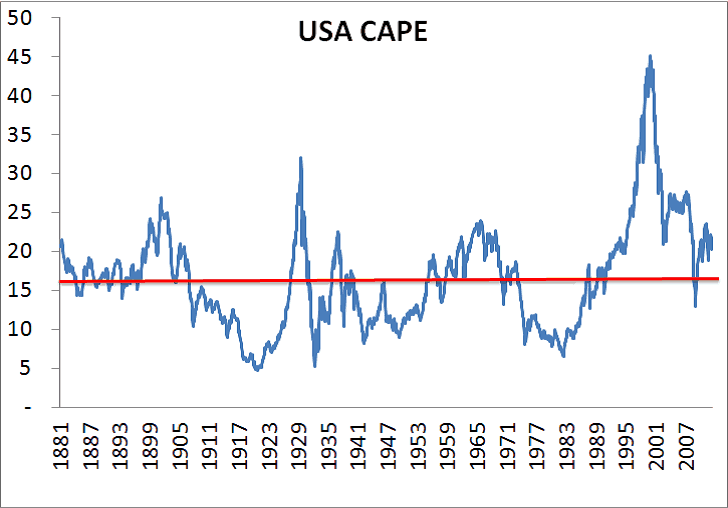
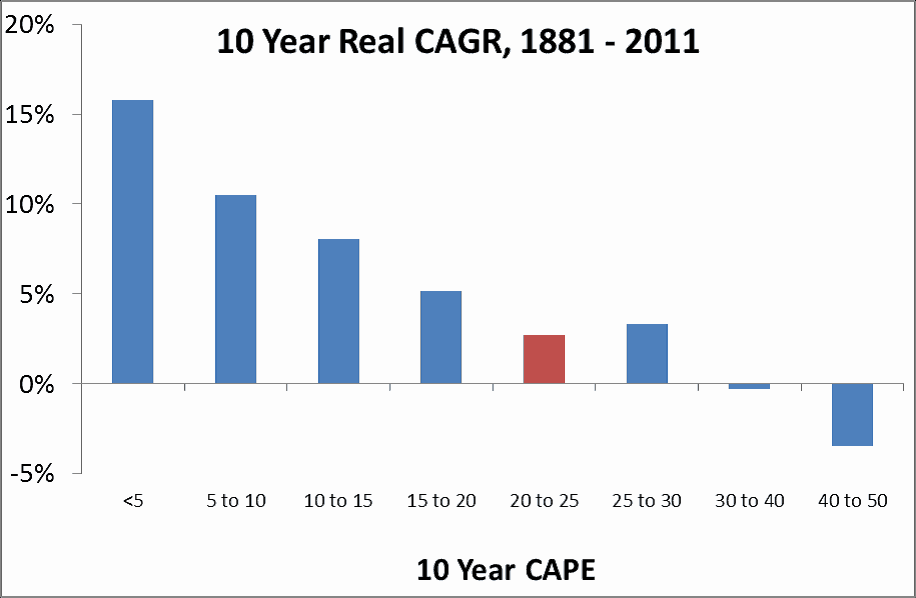
As you can see in the figure below, future returns are highly dependent on starting valuations. The current reading as of the end of 2012 is 21.55, about 30% above the long-term average of around 16.5. At the current levels of 20-25, future returns have been an uninspiring 6% nominal, and 3% real since 1881. Not horrific, but not that exciting either.
Figure 2 – Ten-Year CAPE vs. Future Returns, 1881-2011
US government bonds on the other hand proved to be a wonderful place to invest during the past twelve years. The compound return was 7.07% and a nice 4.5% after inflation. The problem with these returns, however, is that they come at the expense of future returns as yields have declined to all time low levels in the US below 2%.
Future bond returns are fairly easy to forecast – it is simply the starting yield. Your ten-year nominal return for buying US government bonds will be around 2% currently if held to maturity.
So, investors are presented with the following opportunity set (assuming 3% inflation going forward, and rounding to make it simple):
US stocks: 6% nominal, 3% real
US Bonds: 2% nominal, -1% real
That leaves a 60/40 investor with a 4.4% nominal return, or a 1.4% real return. Not exactly exciting!
So where should investors look for outsized returns while managing their risk? We examine the effects of expanding a traditional 60/40 allocation into a more global allocation in the coming pages. We then overlay some simple risk management in hopes of protecting a portfolio against brutal bear markets.
