Below we have updated our 2006 white paper. While you can download the full 70+ page paper here, I’ve also chopped it up into a series of more digestible posts for the blog.
PRACTICAL CONSIDERATIONS AND TAXES
There are a few practical considerations an investor must analyze before implementing these models for real-world applicability – namely, management fees, taxes, commissions, and slippage.
Management fees should be identical for both the buy and hold and timing models, and will vary depending on the instrument used for investing. 0.10% to 0.70% is a fair estimate range for these fees using ETFs and no-load mutual funds (obviously the lower the better). Many all-ETF portfolios can be formed for approximately 0.1% to 0.3%.
Commissions should be a minimal factor due to the low turnover of the models. On average, the investor would be making three to four round-trip trades per year for the portfolio and less than one round-trip trade per asset class per year. Likewise, slippage should be nearly negligible, as there are numerous mutual funds (end-of-day pricing means zero slippage) as well as liquid ETFs an investor can choose from.
Taxes, on the other hand, are a very real consideration. Many institutional investors such as endowments and pension funds enjoy tax-exempt status. The obvious solution for individuals is to trade the system in a tax-deferred account such as an IRA or 401(k). Due to the various capital gains rates for different investors (as well as varying tax rates across time, as well as the impact of dividends) it is difficult to estimate the hit an investor would suffer from trading this system in a taxable account. Most investors rebalance their holdings periodically and introduce some turnover into the portfolio even for a buy and hold allocation – and it is reasonable to assume a normal turnover of approximately 20%. The system has a turnover of almost 70%.
Gannon and Blum (2006) presented after-tax returns for individuals invested in the S&P 500 since 1961 in the highest tax bracket. After-tax returns to investors with 20% turnover would have fallen to 6.72% from a pre-tax return of 10.62%. They estimate that an increase in turnover from 20%-70% would have resulted in an additional haircut of less than 50 basis points to 6.27%.
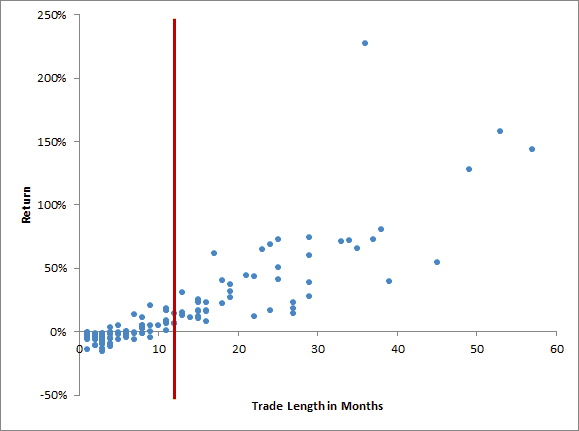
There is some good news for those who have to trade this model in a taxable account. The system results in a high number of short-term capital losses, and a large percentage of long-term capital gains. Figure 17 depicts the distribution for all the trades for the five asset classes since 1973. This should help reduce an investor’s tax burden.
Figure 17: Length of Trades for Timing Model, 1973-2012