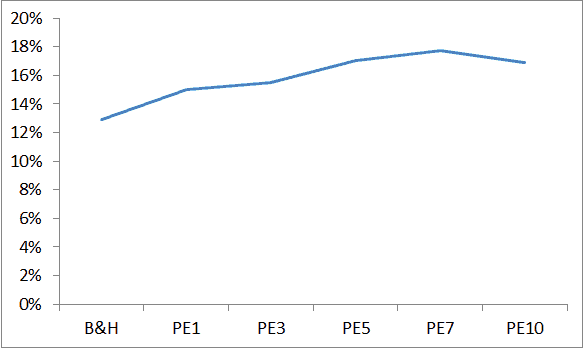
In honor of the good professor winning the Nobel prize today, I thought I would show a quick chart we have never published. It is from our global CAPE paper, and simulates our tests, but this time with various CAPE measurement periods of 1-10 years. Note that most analysts use 1 year PE ratios, and also note which metric is the worst (1 year). It seems the best range is near where old Ben Graham preferred, 5-10 years.
Smoothing value indicators has the added benefit of reducing turnover…
Chart is CAGR from 1980-2012: