Note: Currently neither I nor any of my clients own GDX, although that may change in the future at any time. This example is meant to be instructive.
One of the classic technical analysis setups is a simple divergence. Below we look at the SPY ETF (S&P 500). Back in 2008/2009, the market was making lower lows while both the RSI and MACD were making higher lows (shown by thick green lines). That is seen as a very basic bullish signal:
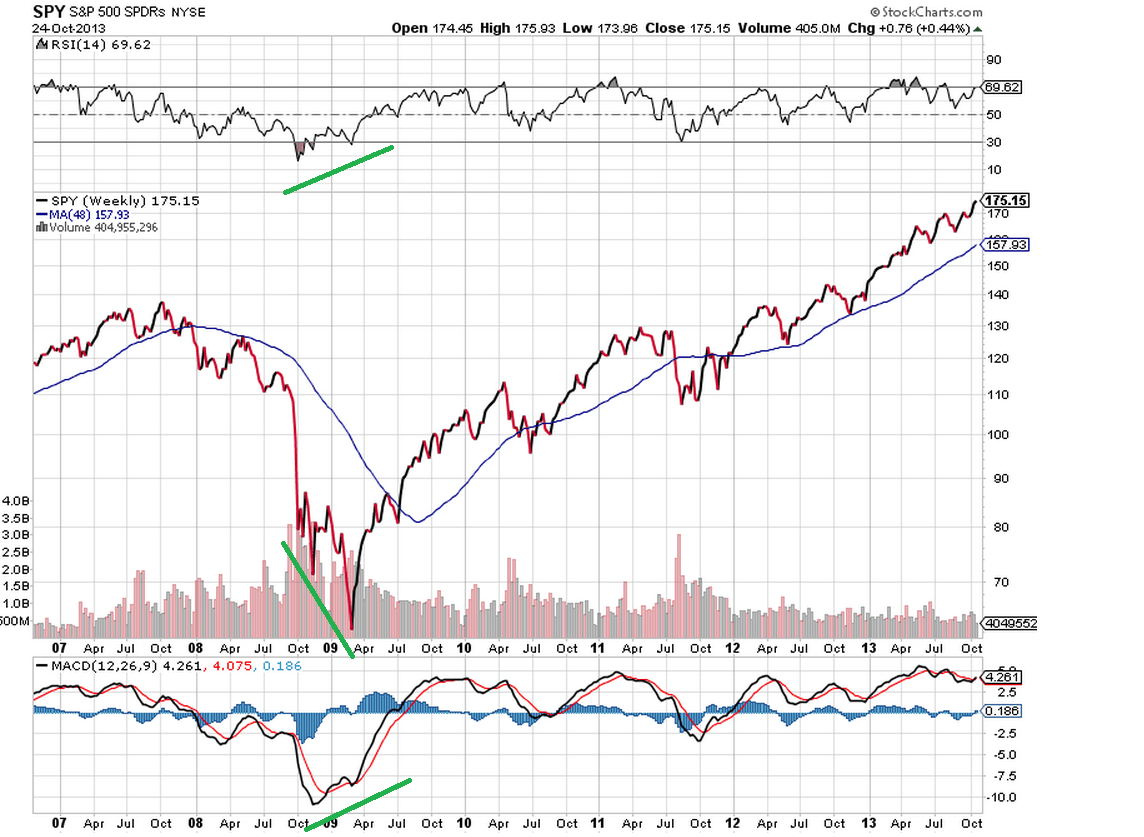
This divergence is also occurring right now in a market that is worth taking a look at, especially since it has been hammered the past couple years. Note that I am not recommending this as a buy, merely pointing out an old technique from the technician’s toolkit. If it keeps going up we will buy some, and if it keeps going down we will wait…:

