I wrote about mean reversion in my book The Ivy Portfolio back in 2008. Below is a chart from the book with a couple studies of what has happened after you buy assets down multiple years in a row. (You can also search the blog archives for words like “reversion” to find lots of old posts like this on CTAs , this on falling knives, and this on homebuilders.) You doubled your returns in the year following three down years for both country stock markets and asset classes.
I wanted to expand this study to the Dimson, Marsh, Staunton database.
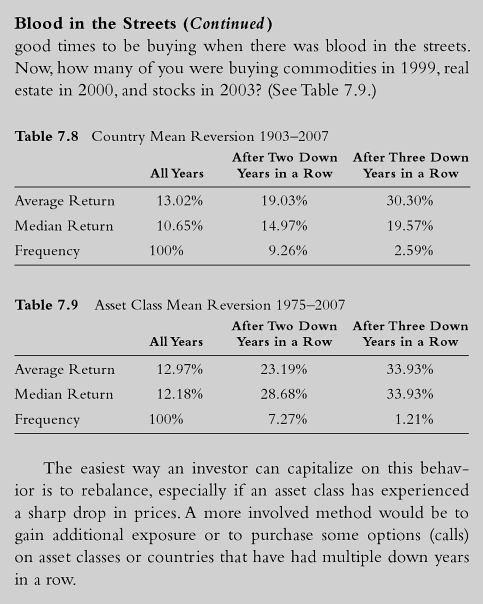
The old study showed median country returns of 10.65% and 3 years down at 19.57%. This only happens about 3% of the time, so pretty rare.
The new DMS database showed median country returns of 8.74% and 3 years down at 15.94%. Similar results of doubling your money, and this only happens about 5% of the time, so also pretty rare.
Great to see the results match in a “sort of” out of sample. I say sort of since equities are fairly correlated, and even though we went from 5 to 18 countries, not totally independent.
Currently I don’t think we have any down three year asset classes (commodities down two), any countries? I’m not certain this applies to industries and highly concentrated sectors due to the higher volatility, perhaps you could volatility weight the results by making it 3 or 4 down years instead of 2 or 3. Will have to look into it. If you decide to run the industry study with the free French Fama data, let me know!
