What about a strategy that is a bit more active? In this follow up to “Simple Cross-Market Momentum”, I take a look at a shorter time-frame – 1 month momentum. The strategy selects the market for the following month with the highest absolute return the previous month. As in the previous study, the strategy is examined since 1972 utilizing diverse and publicly traded asset class indices including US Stocks (S&P 500), Foreign Stocks (MSCI EAFE), Commodities (GSCI), REITs (NAREIT), Cash (90-Day Commercial Paper), and United States Government Bonds (10-Year Treasury Bonds). Total return data is used.
Two notes:
1 – This strategy is active, so unless it was traded in a tax free account (or you happen to enjoy tax-free status like endowments and pension funds), you are going to get hit on capital gains taxes.
2 – No commissions, slippage, or management fees are deducted. Depending on the particular situation of the investor, this factor could be a huge difference in performance or a marginal rounding error. . .
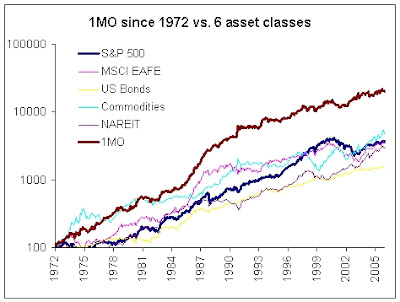
 The average CAGR for the six asset classes since 1972 was 10.74%, and the range in CAGR for the asset classes was 8.35% (Bonds) to 12.03% (GSCI). The one-month momentum (we’ll call it 1MO for brevity from now on) method returned an impressive 16.90%. The average asset class volatility was 19.14% vs. 17.33% for the 1MO. The average drawdown across asset classes was -(43.27)% vs. -(22.41)%. Higher return, lower volatility, and lower drawdown.
Here is an equity curve of 1MO vs. the 6 asset classes (I bolded the 1MO and S&P500 equity curves for emphasis)…
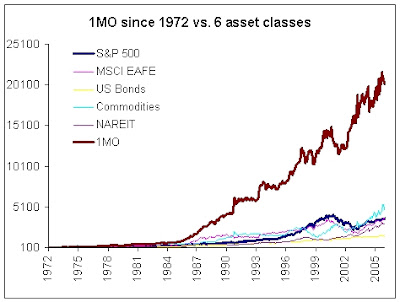
And just for fun, to show the difference a little compounding makes, a non-log graph:
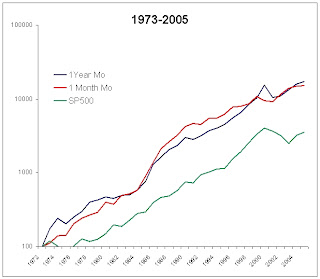
Momentum can add value at both the one-month and one-year time frames. The one-month is slightly superior in volatility and drawdown to the one-year time frame. When you take an average return of the yearly equity curves for the 1-Year and 1-Month, they keep the high return with volatility dropping to ~15%. Below is an equity curve of the two strategies compared to the S&P500.
Example ETFs reflecting the asset classes discussed in post are:

