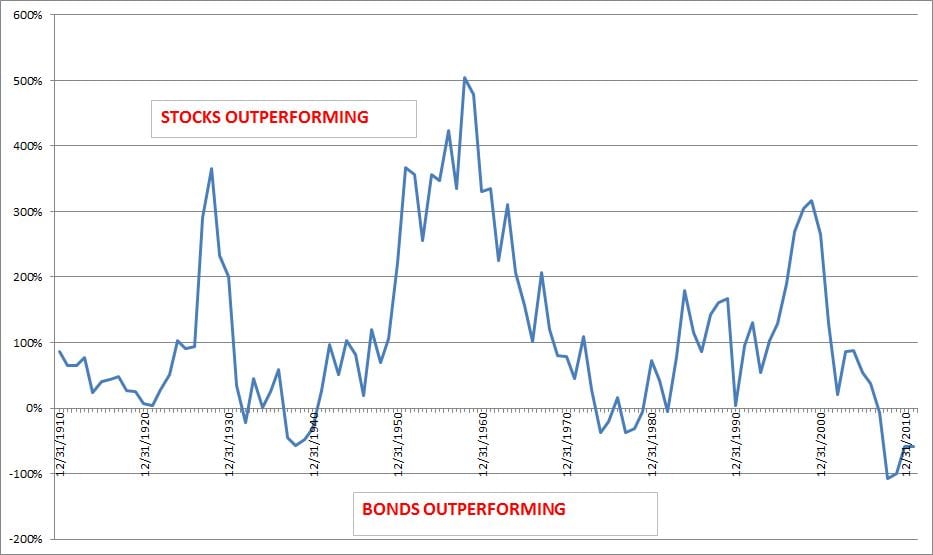
I posted the below charts about a year ago. They are often used to justify a generational buying opportunity in stocks.
Both charts show the 10 year rolling returns of stocks vs. 10 year govt bonds.
As you can see, bull markets tend to top out at around 300-400% outperformance over bonds. Bear markets rarely get up to 100% bond outperformance.
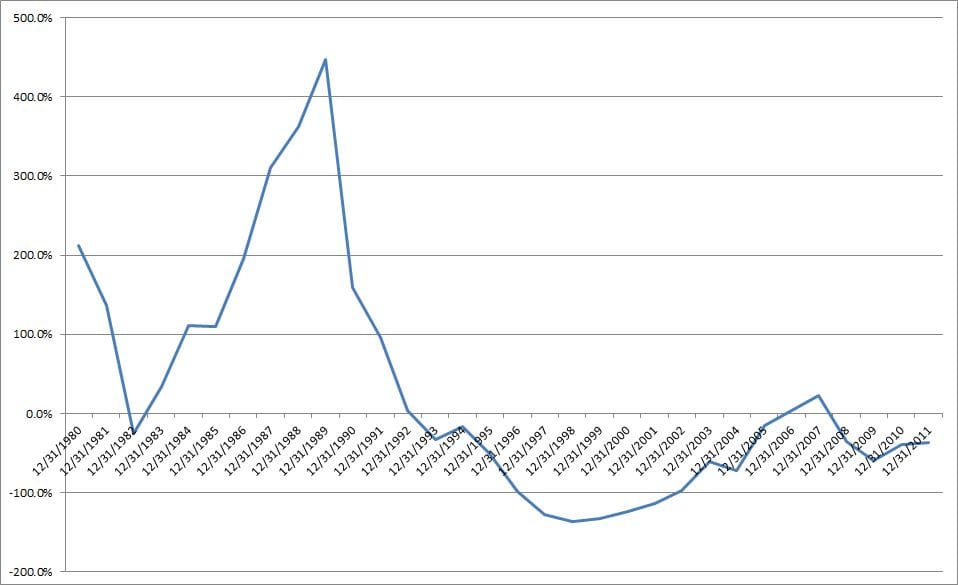
However (and there always seems to be a however in investing), in Japan, this bond outperformance has dragged on for decades. Below is the same chart in Japan since the early 1980s. (Long time readers know I spend a lot of time referencing Japan, recent article on Japan here: What if 8% is Really 0%? ) Currently, after a brief resurfacing a few years ago in 2006/2007, the bond outperformance is continuing.
Now, can you imagine having this conversation in 15 years after 15 MORE years of bond outperformance? If you cannot fathom that, then you are not prepared for all of the potential outcomes and how they might affect your portfolio.


