“In 97 clients were upset, in 98 they were mad and in 99 they were all gone. I lost 7 out of 10 clients ” Jean-Marie Eveillard, at the Online Value Conference, via @MacroTool
I can talk about strategies and approaches on this blog (since it is my personal blog) but I stay away from mentioning anything I do work related, or performance of funds for compliance as well as headache reasons. (But all of our funds and their performance is public, just head to Cambria website, or AdvisorShares or Morningstar.)
However, I thought I would tackle a few questions on the very simple strategy we published way back in 2007 in our paper A Quant Approach to Tactical Asset Allocation.
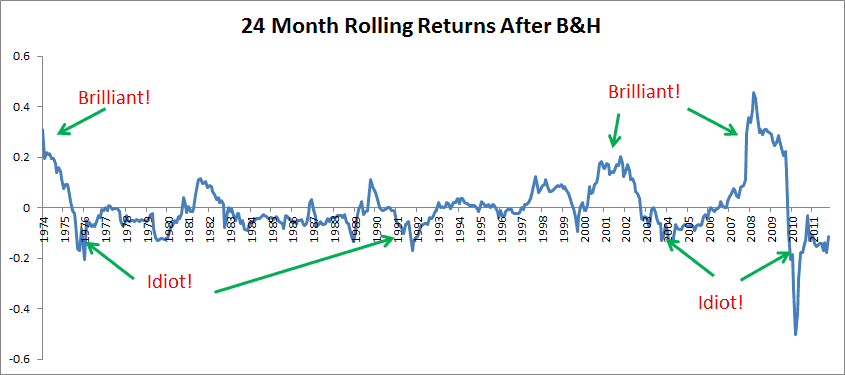
Two questions I often get are contained in the title, why are you out/under performing? Technically, we get the latter much more often as no one really ever asks that much why you are outperforming, but this year is a perfect example. The QTAA approach (which for those that are new is a simple trend approach to five broad asset classes) that we published is a nice base case scenario from which to benchmark trend strategies. Over time it does a great job of reducing volatility and managing drawdowns. However, since by definition it varies widely from the buy and hold portfolio, performance will diverge.
Like the Eveillard quote above, there will be months and years where it underperforms, and months and years it ourperforms. Below is a simple chart that details 24 month out/underperformance of the timing strategy net of the buy and hold returns. As you can see, there are periods of massive outperformance (2000-2003 and 2008/9 recently), as well as periods of underperformance.
Which, I imagine it is time to update some of our papers, and more likely do it in a cohesive piece in the next few months. So, two questions for you: Any questions you’ve always wanted answered? Any title suggestions? Let me know what you would like to see in an update and we’ll try and get something out by year end or Q1 2013…


