1. 100% S&P 500
2. 60% S&P500 & 40% 10 Year US Govt Bonds
3. 20% S&P500, 20% Foreign Stocks (MSCI EAFE), 20% 10-Yr US Govt Bonds, 20% REITs, & 20% Commodities (GSCI)
(AA is #3, the asset allocation portfolio). All figures are total return data, including dividends and rebalancing.
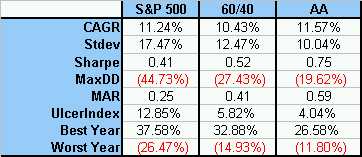
As you can see, diversification mainly acts to reduce your risk (although it actually has the highest CAGR of the three as well). A drawdown of 44% for the S&P500 during the 2000-2003 bear market was reduced to a much more manageable 20%.
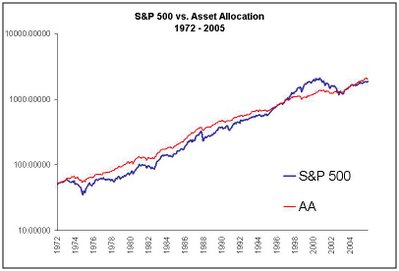
The equity curve pictured here shows the simple effects of a diversified portfolio. An equal weighted 5 asset class portfolio (AA) vs. the S&P500 for the past 30+ years. They both arrive at the same finish line, but one with much less volatility. . .
