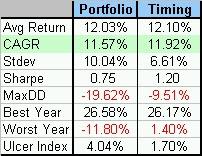
One of the most often asked questions I get regarding my paper is “Why do you have such a large allocation to real assets?” (ie I divide the asset classes evenly with 20% weightings, thus assigning 20% each to Commodities and REITs).
The main reason was making the portfolio as simple as possible. Second, I wanted to emulate the endowment method of investing. As described in a previous post where I examined the Harvard and Yale endowments – once you stripped out the private equity and hedge funds (something the typical retail investor doesn’t have access to and they are neither liquid nor exchange traded), and then averaged the two endowments, the results were a near even distribution between US Stocks, Foreign Stocks, Real Estate, Bonds, and Commodities.
Inspired by all the Laziness going on at the Kirk Report (they’re reporting on Guru recommended asset allocation weightings), we set up to examine the historical performance of each Guru portfolio since 1972. We will provide both historical returns for that strategy, as well as the results had you used my timing method. All results are total return, gross of any fees or taxes, and rebalanced.
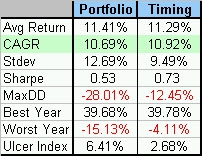
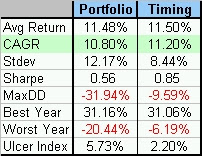
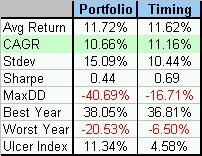
Portfolio will refer to buy and hold, while “Timing” will refer to the trendfollowing method outlined in my paper. Sharpe uses 4% rfr, and MaxDD = maximum drawdown since 1972.
1. Endowment Model (From my paper)
20% US Stocks (S&P 500)
20% Foreign Stocks(MSCI EAFE)
20% US 10Yr Gov Bonds
20% Commodities (GSCI)
20% Real Estate (NAREIT)
2. 60/40 Standard Allocation
60% US Stocks, 40% US Bonds
3. Andrew Tobias Three Fund Lazy Portfolio (Also similar to Bill Shultheis & Scott Burns’s 3 Fund portfolios)
33% US Stocks
33% Foreign Stocks
33% US Bonds
4. Swensen model, from his book Unconventional Success
30% US Stocks
20% REITs
20% Foreign Stocks
30% Bonds (He recommends short term US and TIPS)
5. William Bernstein Basic No-Brainer Portfolio
25% US Stocks
25% Small Cap Stocks (We use Nasdaq as our small cap index doesn’t start till 1978)
25% International Stocks
25% Bonds
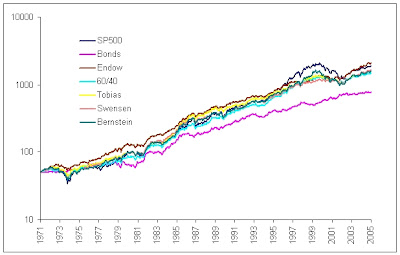
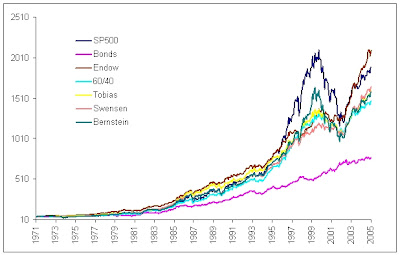
Here is a summary of the results for the Buy and Hold allocations (Note that the Timing model increased the Sharpe ratio in every case). As you can see, the endowment method produces both the highest CAGR with the lowest volatility (lower than bonds), resulting in the highest risk adjusted returns. This is very likely due to the inclusion of commodities into the portfolio, an allocation that Guru’s have been missing for a long time. What is interesting to note is that virtually all the Guru portfolios have about the same characteristics, notably not acting much differently than a simple 60/40 stock bond allocation. The endowment method produces returns that are equity like, with bond like risk and drawdown measures. As is often missed in the asset allocation debate, the golden key is finding truly uncorrelated asset classes. . .Comic books anyone?
What Buy and Hold Allocation had the best risk adjusted returns? In order from Best to Worst was (Sharpe, CAGR):
Endowment .75, 11.57%
Swensen .56, 10.80%
Tobias .53, 10.69%
60/40 .52, 10.43%
Bernstein .44, 10.66%
S&P500 .41, 11.24%
Bonds .39, 8.35%
Below are the equity curves that closely resemble rainbows. . .both log and non-log.
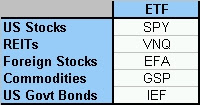
Example ETF’s that reflect asset classes discussed in this article are:

