Is it time to buy an asset class or industry when everyone else is puking it up?
Following up on our posts on mean reversion in equity markets and asset classes (here and here), I examine the properties of industry level mean reversion. The data used is yearly industry data from Standard and Poor’s (thanks to Sam Stovall), and includes 40 industries (I only used the ones that had full data history since 1969, eliminating roughly half). This is annual price data no-dividends, pre-GICS from 1972-2001 (needed 3 year ranking to start study).
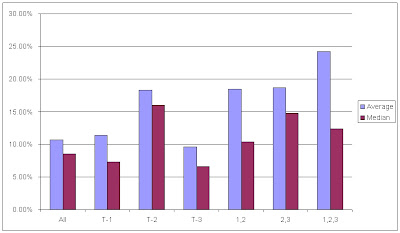
The study examines industry performance x-years after a negative year. Thus, T-1 is a negative year last year, T-2 is a negative year two years ago, etc. 1,2 represents negative years 1 and 2 years ago, etc.
The simple take-aways are that mean reversion occurs mainly at the 2-year timeframe (which is inconsistent with earlier work that shows equity indexes displayed mean reversion at 3 years as well). The more obvious result is that it pays to buy industries that were down a few years in a row.
Speaking of mean reversion, I’m sure the boys at Goldman are hoping for some performance mean reversion after last month – Global Alpha.


