World Beta listens to reader questions and pens the responses over the Easter holiday.
It is gratifying to see that my paper on tactical asset allocation just broke into the Top 300 downloaded papers on SSRN (out of over 116,000 papers). I receive a few questions fairly consistently, and I thought I would address the most common below.
Have you tested a long/short version of your model?
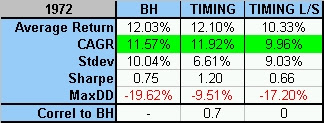
I initially did not want to include the L/S version in my paper for a number of reasons. The content was written so that most investors could digest the material (I found trimming the paper and excluding discussions on topics such as skew and kurtosis resulted in many more people finishing the paper).
The results of a long/short version are below, and the figures are in-line with what I would expect. The return is reduced, with increases in volatility and drawdown. Also not surprising – the correlation to buy and hold drops to 0 for the L/S version.
Why do you have such a large allocation to real assets?
Two reasons. First, I thought the discussion would be simpler if the asset classes were evenly distributed. I also wanted to include as many distinct asset classes as possible, and I view the five included as the main asset class categories.
Second, the percentages are similar to the allocations for the Harvard and Yale endowment funds once you back out the private equity and hedge fund allocations.
Have you tried adding small cap exposure?
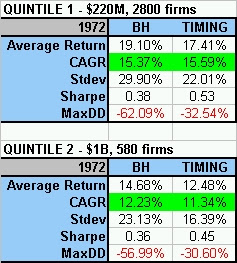
Yes, the results are below for small caps. I used data from Kenneth French’s data library. He divides stocks into five quintiles based on size, and the average size (as of year end 2006) and # of firms is listed. Small caps as I define them fall somewhere between the two buckets. The results since 1972 are as expected, and dividing up the US equity exposure 50/50 to large & small results in higher return and Sharpe figures. Substituting small/microcap ETFs such as PZI or IWN could produce similar results.
What is the difference between yearly and monthly rebalancing?
Virtually identical. Most important is that the investor rebalances at some point, but yearly is fine.
Have you tested this model on daily or weekly data?
No, but other researchers have with confirming, and superior, results.
Why does your Sharpe Ratio not scale for the leveraged version?
I use the broker call rate as the measure of borrowing costs. Realistically, some brokerages have high borrowing rates near the BCR, but others such as Interactive Brokers, have rates that are considerably less and closer to the risk free rate. If you assume borrowing costs at the risk free rate, the Sharpe Ratio will be the same for the 1X and 2X.


