 Brad Zigler has a great article over on SeekingAlpha on the S&P Case/Shiller housing futures – “Does Hedging Make You A Chicken?“.
(For more info on housing futures, check out the MacroMarkets site and the S&P Case/Shiller site.)
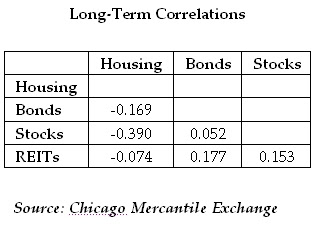
The most interesting chart from the Merc website is the correlation table below which basically shows that housing is negatively correlated to the major asset classes, and has zero correlation with REITs. (I ran a quick calc and found a .3 correlation with the GSCI).
Instead of hedging, I would think someone running a big enough beta allocation program would want exposure to housing as an asset class – possibly by dividing the real estate exposure into housing and REITs.
I see no reason why the timing model would not work for the housing futures as well. Out of curiosity I plugged in each of the markets into a simple 10-month moving average model and here are the results. It would make more sense to me to hedge when the markets were on a “sell” signal. (June 2007 values.) Atlanta, Charlotte, Portland, Dallas, and Seattle are at all time highs. Detroit is the furthest from its high at -13.76%.
Phoenix – Sell
LA – Sell
SD – Sell
SF – Sell
Denver – Buy
Washington DC – Sell
Miami – Sell
Tampa – Sell
Atlanta – Buy
Chicago – Sell
Boston – Buy
Detroit – Sell
Minneapolis – Sell
Charlotte – Buy
Las Vegas – Sell
NY – Sell
Cleveland – Sell
Portland – Buy
Dallas – Buy
Seattle – Buy
Composite – Sell
Composite 20 – Sell
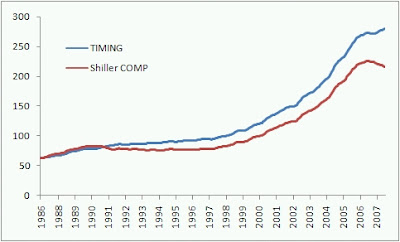
Here is an equity curve if you were trading the 10-composite housing futures since 1987. Slightly better returns with less risk. The timing model would have exited in October 2006.
A couple other interesting notes from the historical data (and a big caveat, 20 years of data is a small sample to draw conclusions from):
The composite had a best year of 18.69% in 2004.
The composite had a worst year of -4.57% in 1990.
LA experienced 6 negative years in a row from 1990-1996.
Chicago has not had a down year since inception.
The worst single year for a city (10 composite) was -10.71% for Boston in 1990.
The best single year for a city (10 composite) was 31.16% for SF in 2000.
Momentum seems to persist. For years that were positive the year prior, the average return for the composite was 8.75%. For negative years the average return the following year was -0.04%. For individual cities, the returns are and 8.4% and -1.51%. Bad news for SD, SF, Denver, D.C., Boston, and NYC.
PS When are we going to see some MACROshares ETFs for the housing market?


