“Did you ever think that making a speech on economics is a lot like pissing down your leg? It seems hot to you, but it never does to anyone else.” Lyndon B. Johnson
I have always believed the correlation of asset classes to be volatile. Coaker has a good series of papers examining the subject. For the most part I feel the same way about factors and macro variables. However, there are certainly relationships that do exist. After all, thats what economists, (some)quants, and intermarket analysts spend much of their time on.
I posted a couple charts earlier in the year on the relationship between gold and inflation, and here is a guest post from the inspiration behind the charts.
Tom McClellan is the editor of The McClellan Market Report, a twice monthly newsletter, as well as its companion Daily Edition. He works with his father Sherman McClellan, who was one of the co-creators of the famous McClellan Oscillator and Summation Index, which are technical indicators that measure the strength of market breadth.
Timer Digest ranks Tom’s stock market signals as #1 for the past 3 months and 6 months. He is also ranked as the #1 gold timer and #4 stock market timer for the 10 year period of 1997-2006. You can learn more about his work by visiting www.mcoscillator.com.
***********************************
The below commentary is from Tom:
Gold has gone above $800. But if you are not a gold bug, a jeweler, or a dentist, you are probably reacting to that news with a shrug and a “so what?”. Well, here is the answer.
In our business of market timing, gold’s biggest value is as a harbinger. Whatever is coming down the pike for a lot of things tends to show up first in gold prices. Precisely why this is the case is far less important than establishing that it is the case.
Back in 1996, I wrote a small booklet for our subscribers called “Predicting The Future: A Guide to Understanding Liquidity Waves”. To my knowledge, this was the first usage of that term “liquidity waves”. The book was a compilation of our research into the way that movements of one market can show up again sometime later in another market. It built upon the work done by Richard Mogey, of the Foundation for the Study of Cycles, as well as others. The main point was that if you can find one of these relationships, and then notice what the price movements are in the leading price series, it can tell you what is going to happen in the lagger series.
The phrase “liquidity waves” is an appropriate one for describing this behavior. Just imagine that you are standing at the end of a pier, and you see a wave pass under your feet. If you know the speed at which waves travel, then you can pretty well figure out when that wave is going to hit the beach. Gold is that observer at the end of the pier. You can learn more about this concept by getting a DVD of a seminar we did on that topic.
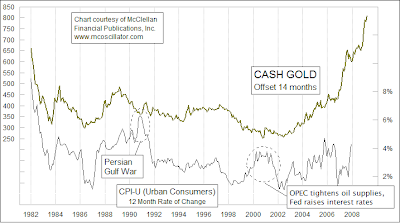
Perhaps the best example of this is the way that the price of gold serves as a leading indicator for what inflation is going to do. You have probably heard the idea that gold acts as a hedge against inflation, but this is not quite the right description. An up move in gold prices signals a coming up move in the inflation rate about 14-15 months later. So if you believe that inflation is going to pick up and want to protect yourself, then the best course of action is to buy gold 14 months ago.
That’s a little bit of tongue in cheek market timing humor, but it makes the point pretty precisely. Gold and inflation are not linked in real time; gold’s movements will precede similar movements in the inflation rate by more than a year. This is illustrated in the chart below, which shows the monthly price of gold compared to the annual rate of change in the Consumer Price Index (CPI), which is commonly referred to as the inflation rate.
In this chart, I have set forward the gold price plot by 14 months to illustrate its leading indication for the inflation rate. The relationship between the two is not perfect, and it can get out of whack when somebody like OPEC puts its thumb on the scale, or when Saddam Hussein decides to annex the 19th province. Aside from such event risk, the relationship works pretty well.
Looking at the current time frame, we are not yet seeing the sort of CPI inflation that gold prices suggest might be in store. A gold price that was up above $700 a year ago ought to mean an inflation rate up around 7-8% now, but CPI growth is still down around 4%. Was gold wrong? Or is something else at work?
This is where you can insert your own conspiracy theories. My belief is that something is funky with the CPI numbers. I see the price of food items going up, I see my medical insurance premium payments up 22% from a year ago, and I see Iowa farmland appreciating at 11% or more because of the demand for corn to make ethanol… All of this says that there is likely more inflation out there than is getting captured in the CPI number, and a higher inflation rate is exactly what gold prices said should be happening.
The latest CPI number showed a big jump (finally!) to above a 4% annual growth rate. If gold is right, then we still have a lot more to go in terms of a rising CPI growth rate. That is going to make it tough on the Fed in its effort to solve the mortgage mess by throwing money at it. That extra money will just go into pushing gold prices higher, keeping inflation climbing, etc.
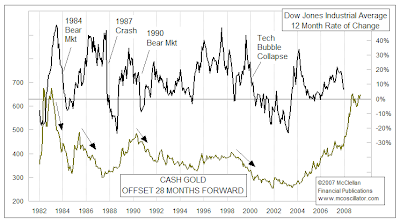
But the rising price of gold is not all bad news. If we look at gold prices with an even longer lag period, we get a pretty good leading indication for what stock prices are going to do. The chart below shows gold prices set forward by 28 months, and it illustrates how this makes a pretty nice leading indication for what the DJIA is going to do. I portray the DJIA in this chart with a 12-month rate of change, which simply measures where the DJIA is now versus where it was 12 months before. This illustrates that a rise in the price of gold tends to show up about 28 months later in rising stock prices.
Why 28 months? I don’t know. That is just the period that works the best to get the relationship right in the chart, and the response to gold’s movements is often not exactly 28 months later in stock prices. I’ll leave it to a more sophisticated economic theorist to explain why it takes 28 months for a surge in liquidity that pushes gold prices upward to show up again in stock prices.
The reason why this is important right now is that the rise in gold prices from $400 to $800 has not yet had its echo in stock prices. We still have that on the future agenda. It is also important to note that the really serious stock market declines have come AFTER a meaningful decline in gold prices, factoring in the 28-month lag. The collapse of the technology bubble after the 2000 top was the echo of a decline in gold prices that had begun after the 1996 top.
Many times, the pain is a delayed effect. Stock prices remained aloft in 1986-87 even though the gold leading indication had already turned down. Eventually, the piper had to be paid, and stock prices crashed downward as if to make up for lost time.
It is worth noting that we have seen no major decline in gold prices in the last two years, and that tells us that we should have no fear of a major decline in stock prices in the near future. Each of the major stock market declines since the early 1980s was foretold by a decline in gold prices more than 2 years before, so the absence of a major gold decline in the current time frame says that the liquidity problems which bring about “major” stock market declines are not in the cards right now. This all assumes that the relationships to gold are going to continue to work as they have in the past, and that is a significant risk. We did not get the CPI response to gold’s rise that the relationship saw we should have seen, and so that may be a problem with the CPI as we suspect, or it may be a problem with gold’s ability to foretell the future.
Hitching one’s wagon to the assumption of rising prices based just on what gold did more than 2 years ago may be a pretty thin basis. But it is a basis which has worked quite nicely for several years, so it is still worth knowing about.


