Ray Dailo has a good comment in the great book 2020 Vision (which, for whatever reason is only available through Mercer in Australia).
“Because I believe that all criteria for investing (that is, good betting strategies) should have a logic that isn’t time specific, I believe that the alpha generators that make up the ultimate alpha generator should be timeless and universal. By that I mean that they should have worked over very longtime horizons and in all countries’ markets.”
I have mentioned a number of different ways to think about and quantify momentum and mean reversion here on World Beta. My personal belief is that as long as humans are involved in the financial markets, the markets will continue to be driven by the emotions of greed and fear. I believe this aspect of the market is a simple example of an alpha generator that is “timeless and universal”.
Real estate falling is an example, as is (maybe) the run up in commodity prices. At some point commodities will quit going up, and real estate and stocks will bounce and continue moving upwards. I have no idea when. (Although 2009 is looking good for Japan if this year is negative.) Jim Rogers touches on some of these topics in his interview in this weekend’s Barrons.
I published a very simple timing model that is based on momentum. There are many, many variants and offshoots one can take the model. For the most part, the take away is that for similar risk, a momentum model generates a little over 3% excess annual returns. You can tweak things and make some improvements, but I consider that the base case for a simple, timeless alpha that is rooted in human psychology.
I wanted to mention another approach to capturing some of this alpha as people have been emailing in asking some questions about reaching for extra return without using leverage.
Question: What about an ‘always in’ method using cross-market momentum?
Using the five asset classes, select the top 3 ranked on the past 12 month return, and update monthly. (So, once a month you look at the five ETFs and hold the 3 with the top performance over the past year. Update it again the following month. Right now the three asset classes would be Bonds, Commodities, and Foreign Stocks.)
The results are virtually identical to the timing model leveraged at 150%. This makes intuitive sense because on average the timing model is 70% long. 70% leveraged 150% is roughly 100% invested on average.
The results are just about the same return (14%+), the same vol (9.5%), the same Sharpe (.80s), and the same drawdown (-15%). The investor would have a little more turnover (about 110% vs. 70% for the moving average model), but not that bad. The yearly returns have a correlation over .8. (And a similar .8 correlation with buy and hold.) Clearly they are capturing similar behavior in the markets.
(There is a lazy man’s version of the cross market momentum that only updates once a year. Besides the benefit of annual maintenance, it is more tax efficient for taxable accounts. Returns are similar with slightly reduced CAGR.)
And because I know people are going to ask, holding just the top asset class results in about 17% CAGR, but with high vol of 18% and drawdown (-45%). The top 2 asset classes is about 16% CAGR, 12% vol, and max drawdown of about -25%.
Another talking head (and academic!) misconception one often hears in the investment soapboxes is that “momentum is dead”.
When using the leveraged timing model at 150% (or the near identical cross-market momentum) to try and equalize the risk with buy and hold, since 1973, it outperformed buy and hold 26 of out the last 36 years. That is roughly 72% of the time. (With a lower drawdown of -15% compared to buy and hold -20%).
What about recently? It has outperformed 9 of the past 10 years.
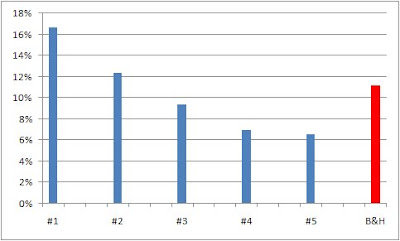
By the way, lots of practitioners and academics sort on 12 month return excluding the recent month due to 1-month mean reversion. This may work with time series data, but with cross market momentum this is completely backwards. Below is the one month returns for the five asset classes since 1972 sorted on previous month returns. The method is simply sorts the past month returns for the five asset classes, then orders them for the next month.
For example, if the S&P was the best performing asset class last month, it would be ranked #1 for this month. Ditto for #2-#5 and repeated monthly. As you can see, the majority of the gains for the 5 asset classes come from the #1 and #2 performing asset class over the previous month. Instead of mean reversion you see momentum. (B&H is simply the five asset classes equally weighted.)


