The Sharpe Ratio is a measure of the risk-adjusted return of an investment. While there are a lot of ways to measure risk, the Sharpe Ratio uses the volatility as measured by the standard deviation of returns. Originally developed by Stanford Professor William Sharpe, it is simply the return of an investment (R) minus cash sitting in T-bills (otherwise knows and the risk free rate, Rf), divided by the volatility of the investment (σ). Cash will have a Sharpe Ratio of zero.
S= (R – Rf) / σ
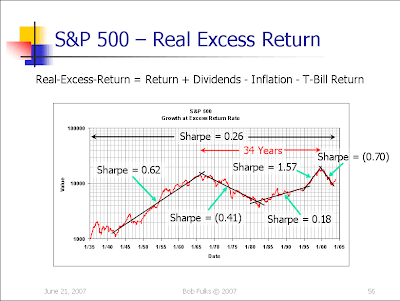
A good rule of thumb for Sharpe ratios is that asset classes, over the long term, have Sharpe’s around .2 to .3. A “dummy” 60/40 allocation to stocks/bonds is around .4. A good all-weather allocation is around .6. However, over shorter periods the numbers can bounce all over the place. From 1900-2007, the S&P 500 has had Sharpe Ratios per decade ranging from -.08 (the 1970s) to 1.4 (the 1950s). If you want more info on the Sharpe Ratio, Bob Fulks has a great piece here.
One of the problems with the Sharpe Ratio is that it “penalizes” upside volatility. An investor likes volatility to the upside, but dislikes volatility to the downside.
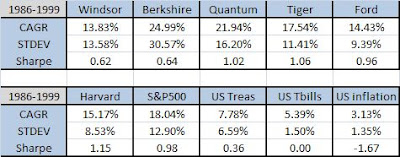
Here is a good PowerPoint that shows some historical Sharpe Ratios for some very successful managers. (It is excerpted from the book Scenarios for Risk Management and Global Investment Strategies ). Ziemba’s point is that managers should not be penalized for upside volatility, only for their losses. So even though Berkshire did almost 25% a year over this time period, it has a lower Sharpe than the S&P500 that returned only 18%. (Great Ziemba PDF here.)
85-00
The Symmetric Downside-Risk Sharpe Ratio (Digest Summary)
William T. Ziemba
Journal of Portfolio Management, Vol. 32, No. 1: 108-122
Vanguard Windsor Fund – Managed by John Neff for 30 years, this fund was regularly in the top 5% of all mutual funds.
Berkshire Hathaway – Warren Buffett’s conglomerate holding company has returned over 20% for the past forty years.
Quantum Fund – George Soros co-managed this fund with Jim Rogers, and it returned over 40% a year in the 1970s. From 1969 to 2001 he did over 30% per year.
Tiger Management – Managed by Julian Robertson.
The Ford Foundation – One of the top performing foundations.
The first observation is how outstanding the returns were for stocks in this period, which inflates the Sharpe Ratio for the S&P 500 to one of the highest levels it has seen in the past century. The second observation is that many of these successful managers are getting penalized for making money with their upside volatility.
To gain a full understanding of a manager’s performance investors should use alternative metrics to evaluate managers. Some alternate metrics include:
Sortino Ratio: uses the volatility of negative asset returns in the denominator (similar to Ziemba’s downside symmetric Sharpe Ratio)
Sterling Ratio: uses the average max drawdown in the denominator
MAR (or Calmar) Ratio: uses max drawdown in the denominator
Ulcer index: Measures the length and severity of drawdowns.
The average return and volatility can tell you a lot, but if you really want to get nerdy check out the third and fourth momements of the return distribution, skew and kurtosis. Check out the white paper “Skewing Your Diversification” by Mark Shore.
Non-linear strategies like option selling can artificially inflate the Sharpe Ratio as they have incredibly consistent good performance until they don’t (which is usually a huge or total blowup ala LTCM).
Below is a chart from fund manager Bob Fulks who shows how an asset can have varying Sharpe Ratios depending on the time period.


