John Hussman is one of the best portfolio managers around. His ability to take complex topics and distill them down to simple readable articles makes his weekly commentary a must read (although he does go off on PhD level rants on occasion).
I thought I would build some Excel sheets that tracked his stock market valuation models in some of these posts:
Estimating the Long Term Returns on Stocks
The Likely Range of Market Returns in the Coming Decade
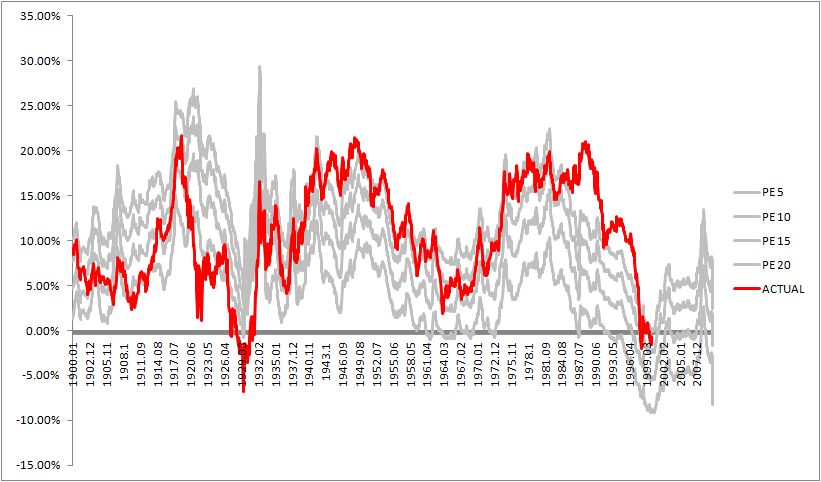
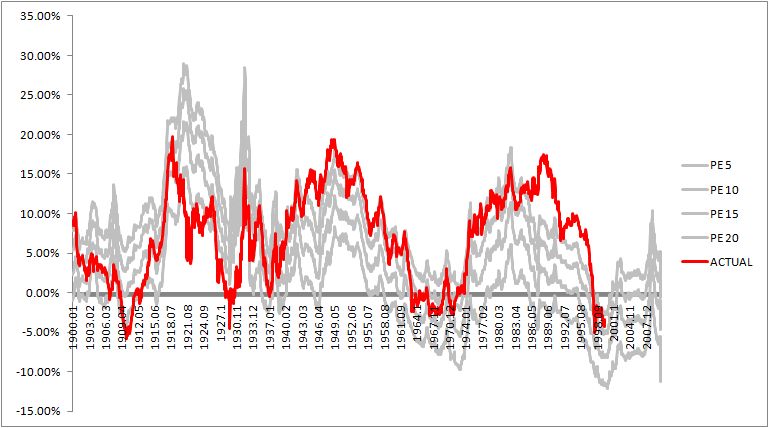
Anyone with a few hours and the inclination can re-create these (I used the Shiller dataset). The charts all look similar (though I took them back to 1900).
The summary from the models is that equities are looking at pretty subdued returns for the next decade. At a terminal PE Ratio of 15 you are looking at about 2% a year. Even at a PE of 20 you are looking at a little of 5% returns. And those are nominal returns.
Real returns are negative or only slightly positive (I included terminal inflation of 3%).
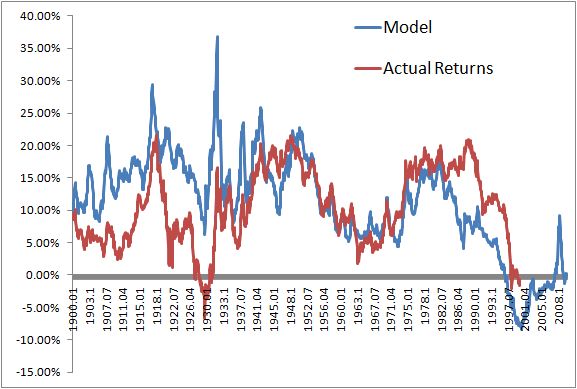
And his dividend model:


