There are not any topics that incite more vitriol than the Federal Reserve and the U.S. Dollar. The following post borrows heavily from The Chart of the Day 11/15 from Ned Davis Research. (If you are not familiar NDR is consistently one of the best quant shops on the Street.)
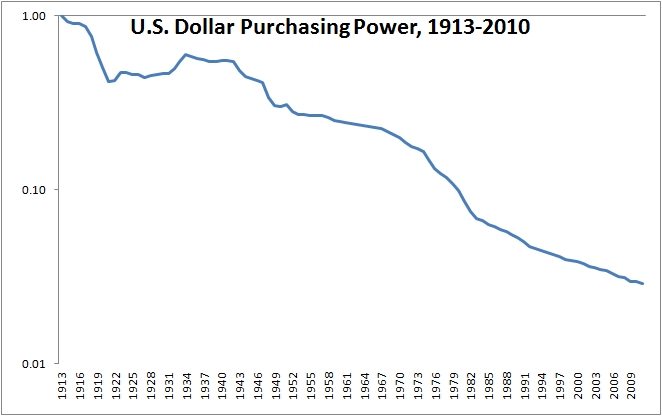
One of the most famous charts in all of the investing literature is the one below that illustrates the U.S. Dollar’s purchasing power since the creation of the Federal Reserve in 1913. The description usually goes along the lines of this ZeroHedge post:
“This is the chart they don’t want you to see: the purchasing power of the dollar over the past 76 years has declined by 94%. And based on current monetary and fiscal policy, we have at least another 94% to go. The only question is whether this will be achieved in 76 months this time.”
The above statement is factually true – $1.00 in 1913 is only worth about $0.03 in current dollars due to the effects of inflation (which have averaged about 3.3% a year). But that is all the chart tells you – that the U.S. has had mild inflation this century (with fits of disinflation, deflation, and high inflation mixed in):

The chart is then used to justify any number of arguments, usually laden with exclamation points!! bold text and large fonts. Cries to end the Fed, buy gold (or sell gold), sell stocks and build forts stocked with guns, food, and ammunition usually follow in a stream of rants and raves. These articles are written like this for a reason as it elicits an emotional response (who doesn’t hate their government?) and certainly makes for great headlines and copy.
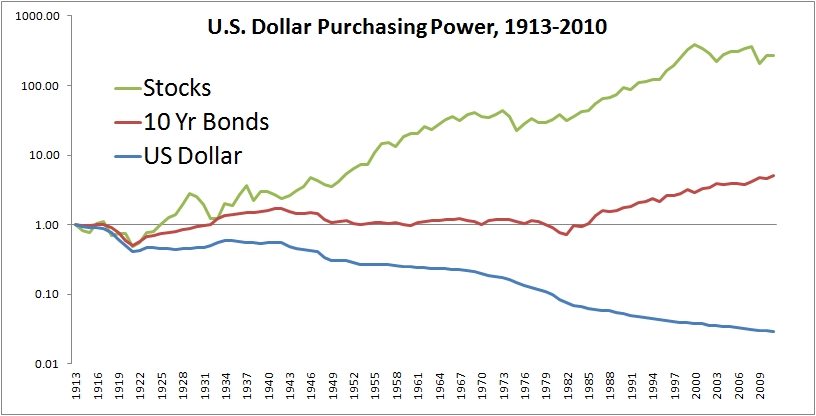
The problem that almost everyone (and I mean everyone) misses is that you have to do something with those dollars. An investor can chose to put them under their mattress, in which case your purchasing power would be just that of the above chart. Or, one could invest in T-Bills, in which case the dollar was a perfectly fine store of value, and your $1 would be worth $1.41 today (for a real return of 0.35% per annum).
However, if an investor decided to take on a little more risk they could have invested in longer duration bonds, corportate bonds, foreign currencies, gold, or even equities all of which would have been better stores of value than your mattress. The below chart shows real returns of stocks and bonds. While $1 would be worth only three cents had you put your hard earned cash under the mattress, it would be worth $1.41 had you invested in T-Bills, $5.05 in 10-Year Bonds, and a whopping $271 in US stocks:
For those looking for a beautiful coffee table book on this topic check out Triumph of the Optimists: 101 Years of Global Investment Returns.
Data Source: Global Financial Data, Shiller


