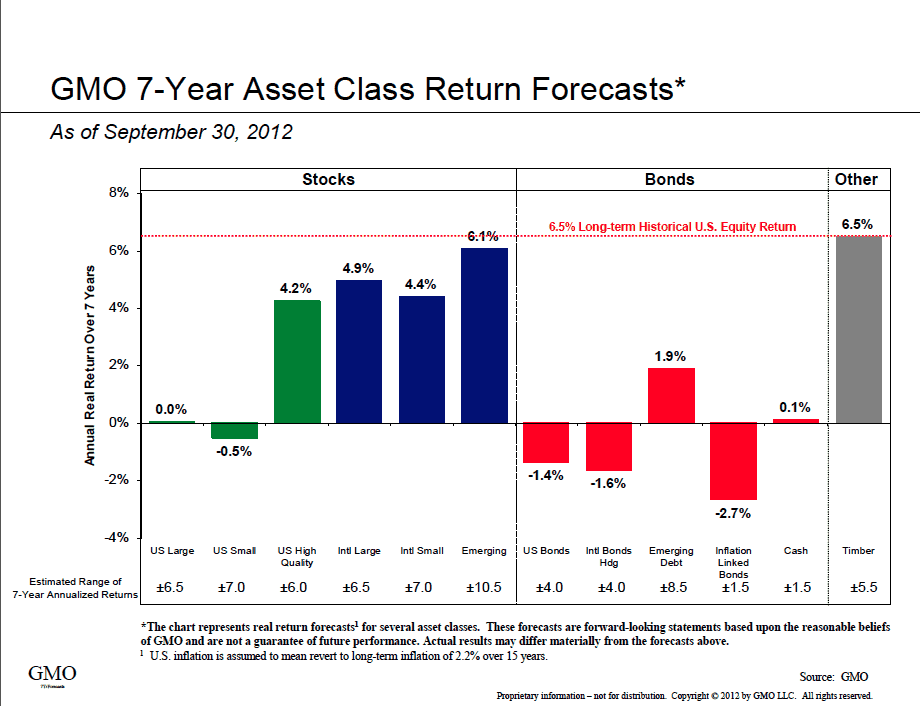
We’ve been having a lot of fun playing around with CAPE data (extending it to PEG ratios, other indexes, etc). GMO puts out their 7 year asset class forecast that is often eerily accurate. Anyways, we included it below along with our estimates of CAPE values for various indexes and as you can see, broadly they are pretty similar and stairstep in the same direction from most expensive, small caps, to least expensive, emerging markets (our EAFE and EEM only cover about 90% of the universe).


