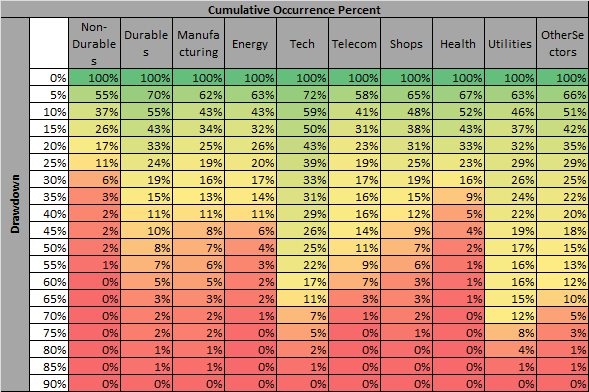
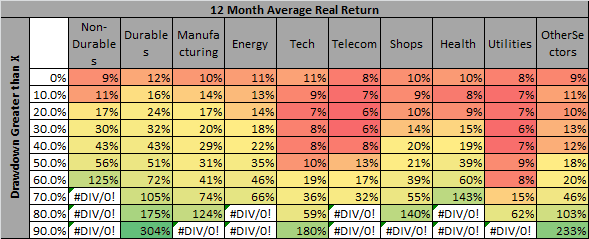
We have posted a lot on reversion and counter trend systems on the blog over the years. One idea Prabhat and I were working on was taking a look at future returns to sectors and industries based on their drawdown level.
Below are a few tables that look at total returns, value weighted, to investors at various timeframes since the 1920s in US sectors. So, the 12 month average real return for Energy at 20% DD means the average return of all the months where energy was in a 20% or worse DD. (Tech and telecom are in the worst drawdowns currently.)
All from French Fama dataset…
My question to you is, what is the best way to turn this into a tradeable system? The best ideas will be tested and posted…We also realized that this will be a bit correlated to the value factor, but we also think that it captures some of the longer term reversion factor that we would like to be able to quantify better…
Obviously it pays to invest in drawdowns, but exactly how one does that without getting burned is the q. Like the famous quote Einhorn mentioned the other day, “What do you call a stock down 90%? A stock that was down 80% and then got cut in half….”
Also here is an older system on short term asset class reversion…(that would have had another successful trade in EAFE and EEM last summer).


