Nice paper:
Strategic Asset Allocation: The Global Multi-Asset Market Portfolio
Abstract:
The portfolio of the average investor contains important information for strategic asset allocation purposes. This portfolio shows the relative value of all assets according to the market crowd, which one could interpret as a benchmark or the optimal portfolio for the average investor. We determine the market values of equities, private equity, real estate, high yield bonds, emerging debt, non-government bonds, government bonds, inflation linked bonds, commodities, and hedge funds. For this range of assets, we estimate the invested global market portfolio for the period 1990-2011. For the main asset categories equities, real estate, non-government bonds and government bonds we extend the period to 1959-2011. To our understanding, we are the first to document the global multi-asset market portfolio at these levels of detail for such a long period of time.
From the paper:
”
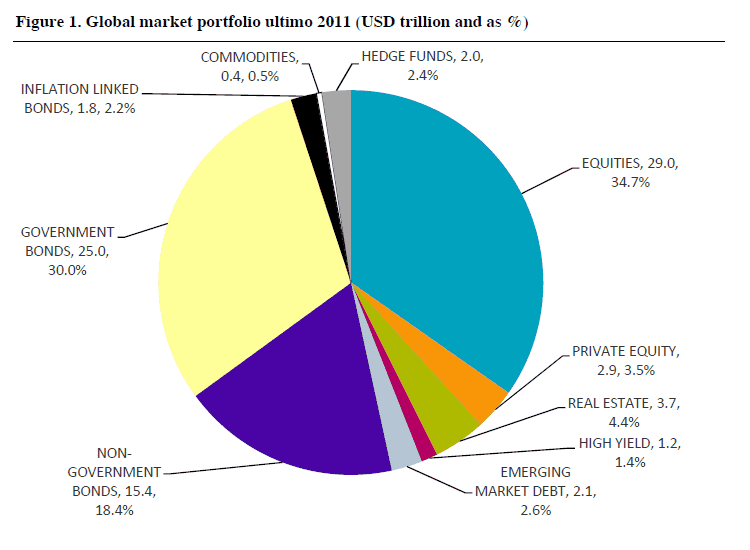
In the appendix we describe our data sources and methodology in detail. Here, once again we stress that we focus on the invested market portfolio. This sums up to the opportunity set that is available to investors. We estimate the total market capitalization of the invested global multi-asset market portfolio at USD 83.5 trillion at the end of 2011. Equities represent the largest asset class with a market value of USD 29.0 trillion, or 34.7% of the total market capitalization of all asset classes. Government bonds follow closely with USD 25.0 trillion, which equals 30.0% of the market portfolio. Non-government bonds, primarily consisting of corporate bonds and mortgage backed securities, are worth USD 15.4 trillion or 18.4%. All other asset categories are relatively small compared to these three asset classes. They vary from USD 0.4 trillion (0.5%) for commodities to USD 3.7 trillion
(4.4%) for real estate. The market capitalization of these seven relatively small asset categories adds up to USD 14.1 trillion (16.9%).”


