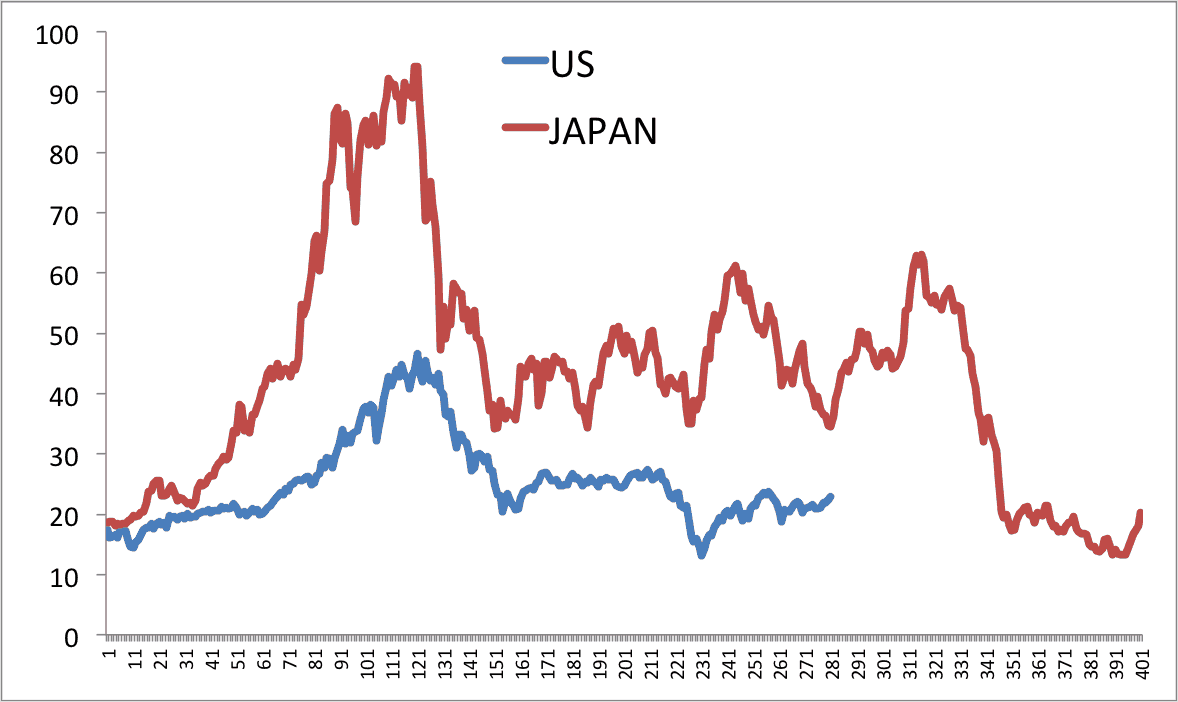
Lots of gyrations in Japan lately. Below is a chart that lines up the US and Japanese 10 year PE ratios so their bubbles are synched. This goes to show just how ginormous the 1989 bubble was in Japan – more than twice the biggest stock bubble in US history (2000). This is also the main reason it took Japan 21 years to get back to a normal valuation while it only took the US 9 years. (defined as CAPE of 17)