Below we have updated our 2006 white paper. While you can download the full 70+ page paper here, I’ve also chopped it up into a series of more digestible posts for the blog.
WHY IT WORKS – VOLATILITY CLUSTERING
One of the benefits of a quantitative system is that it protects the investor from innate behavioral biases. A discussion of some of the more insidious biases can be found in the Appendix. Of course, this information is not only valuable for figuring out our own biases – other people’s mistakes leave the door open for us to soak up some of that elusive alpha. As far as excess returns are concerned, for someone to gain, someone else has to lose. People consistently make the same mistakes that are hard-wired into their brains, and they do so over and over again.
Humans use a different part of their brain when they are losing money than when they are making money. We put together a 17-page white paper to address the topic called “Where the Black Swans Hide and the Ten Best Days Myth”.
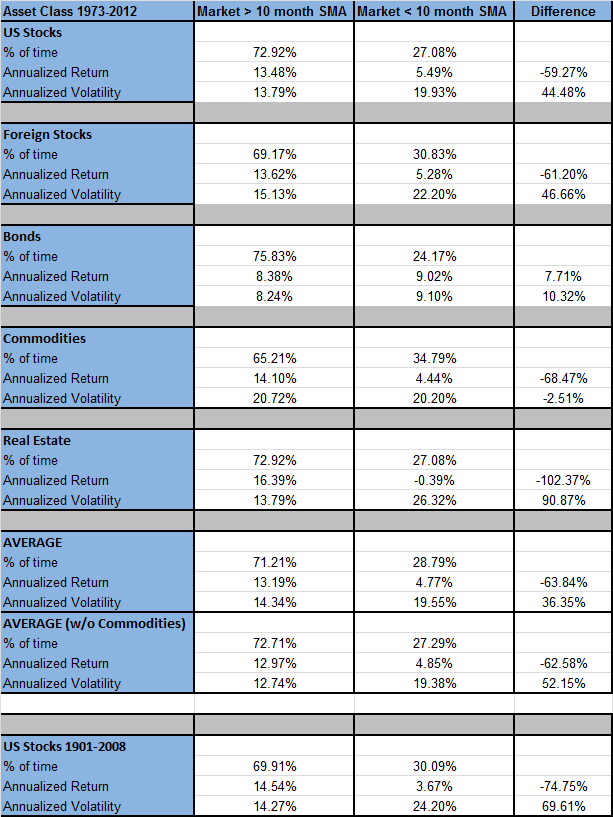
Figure 18 shows the annualized returns and volatility for the five markets we studied in this paper. On average, the returns are 60% lower and the volatility 30% higher when the market is below its 10-month simple moving average. Commodities are the one exception where volatility is not higher when below the moving average, which makes intuitive sense. Commodities are often driven by supply shocks that can result in price spikes.
2008 is a prime example with volatility levels in stock markets around the globe exploding to record levels. However, this volatility has occurred after the markets already began declining.
Figure 18: Volatility Clustering Across Various Asset Classes