I used the word “normal” above on purpose, as there is really nothing normal about stock returns. They tend to be more extreme than people realize, obeying the distribution of power laws rather than any sort of bell curve world. (We have a fun paper on the topic, Where the Black Swans Hide and the Ten Best Days Myth).
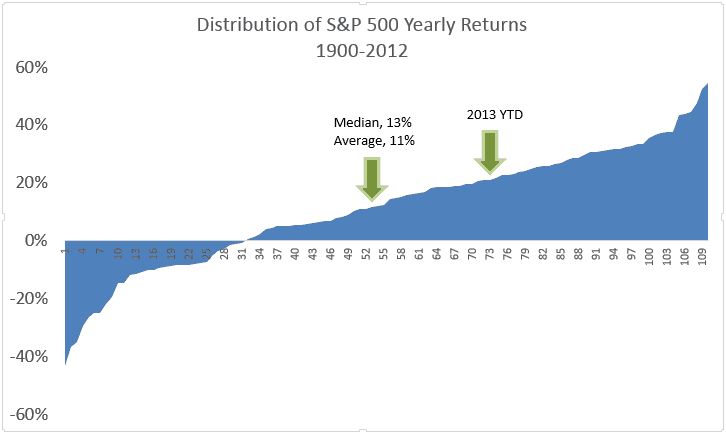
We’ve had a monster year in stock (even though we think they are expensive) thus far here in the US, so it is worthwhile to review where this year (if it ended today) would stand in history. Interestingly enough, about a third of all years have HIGHER returns… I’m guessing that would surprise most readers. The median is around 13%, the average 11%, and the geometric average about 9%. (Damn those volatility gremlins!)
Below is a chart with a distribution of all the stock returns since 1900. Now what would really surprise people…a 30-40% up year…