This is a good post over from the Eudora Fund website looking at the distribution of value factors across time…
Quotes from site:
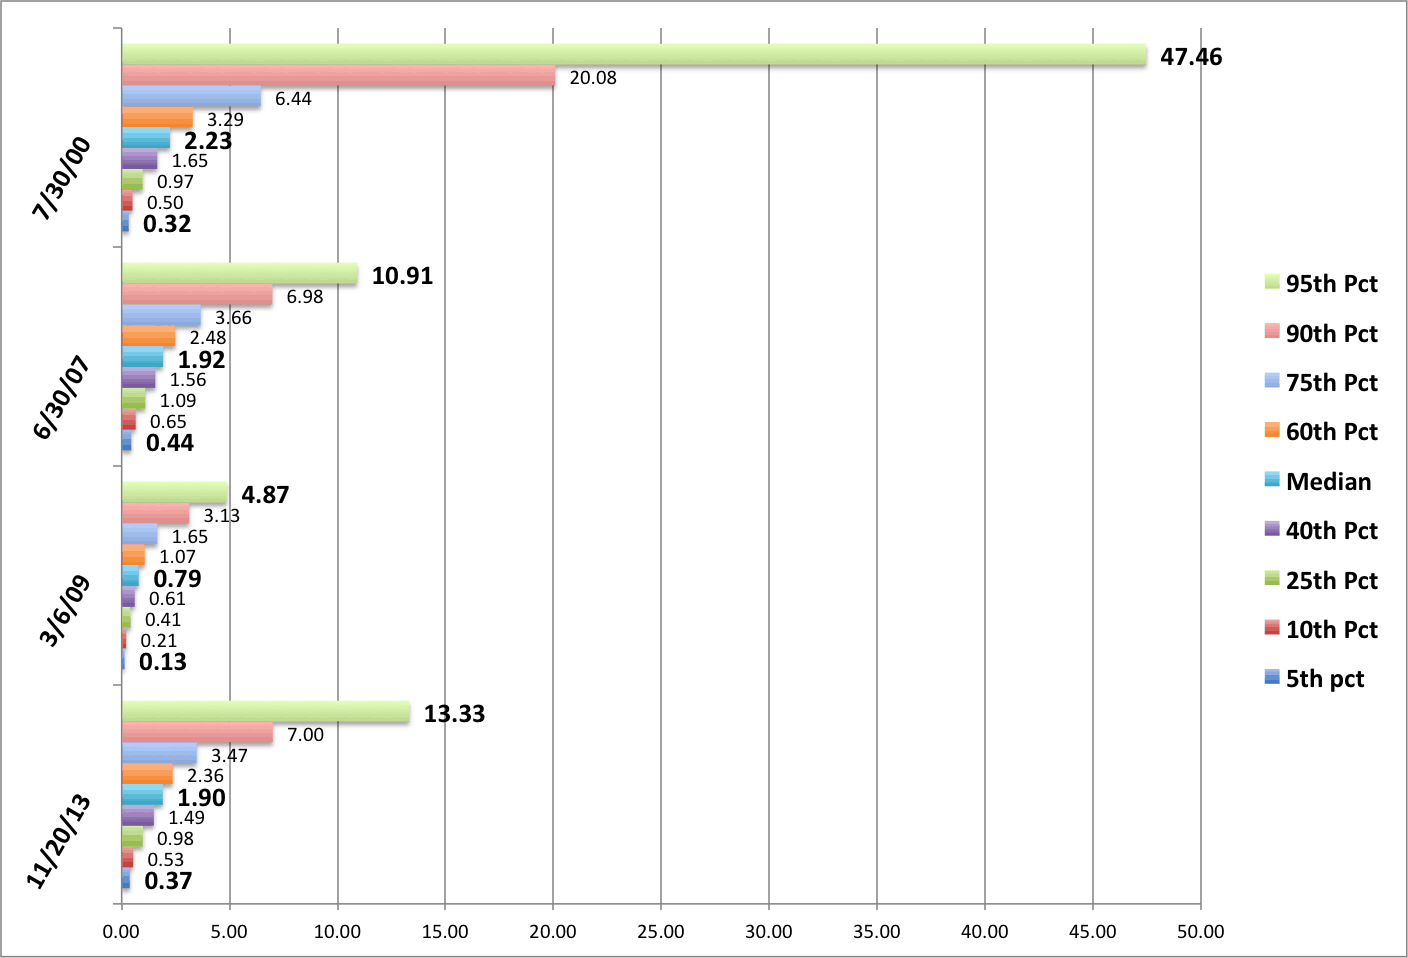
For readability’s sake, I’ve bolded the 5th and 95th percentile values, as well as the median, in each of the valuation distributions. Some interesting statistics from the above chart:
- The most expensive part of the market, i.e., the 95th percentile, is more expensive today than it was at the top of the 2007 market, trading at more than 13-times enterprise value to revenue vs. about 11-times in 2007.
- The cheapest part of the market today, i.e., the 5th percentile, is actually slightly cheaper than it was in 2007 at 0.37-times EV/Revenues vs. 0.44-times EV/Revenues. Strangely, the cheapest part of the market in 2000, was even cheaper than today.
- The median stock is valued at roughly the same today as it was in 2007, at around 1.9-times EV/Revenues. This is about 10% cheaper than the median stock’s valuation in July of 2000.
- Parenthetically, the most expensive EV/Revenue portion of the market in 2000 was simply insane, at close to 50-times revenues.