This was a fun paper I sent to The Idea Farm a few weeks ago. A few tidbits:
http://ssrn.com/abstract=2447654
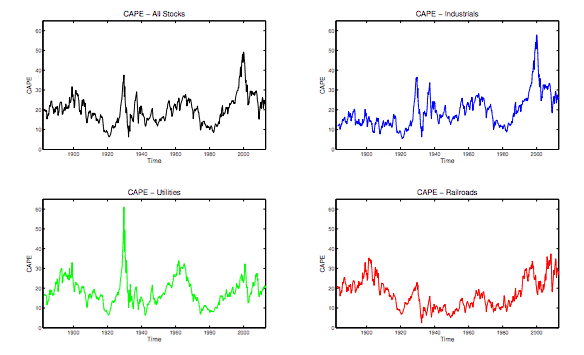
“We plot the CAPE ratio for the overall market as well as for the three sectors Industrials, Utilities, and Railroads
in Figure 4. Note that the CAPE ratio of the three sectors shows a relatively similar pattern across sectors through
time, but there are significant differences. Notably, in the 1929 peak, the Utilities sector stood out, because of a sharp increase in the numerator of the ratio, and Utilities’ CAPE ratio set the all-time high record in the third quarter of that year with slightly more than 60. In that same quarter, the CAPE ratio for the Industrials sector was high, but much less so, only slightly more than 36. In comparison, the Railroads sector’s CAPE ratio at that time was around 20. The other dramatic peak, in the fourth quarter of 1999, was dominated not by the Utilities sector but by Industrials, when the Industrials sector’s CAPE ratio reached nearly 58 then. In comparison, the CAPE ratio for Railroads at that time varied between somewhat more than 30 and approximately 15 and the ratio for Utilities barely exceeded 30 at its peak. The all-time record low in our sample was set by Railroads, in the second quarter of 1932, with the CAPE ratio dropping below 2.5. During that time, Industrials’s CAPE ratio was also low at close to 6 and Utilities’ CAPE ratio came close to 10. We venture that these broad swings in entire sectors of our economy are not entirely due to changes in rational expectations for the future dividends and earnings, and must mean something for subsequent returns.”