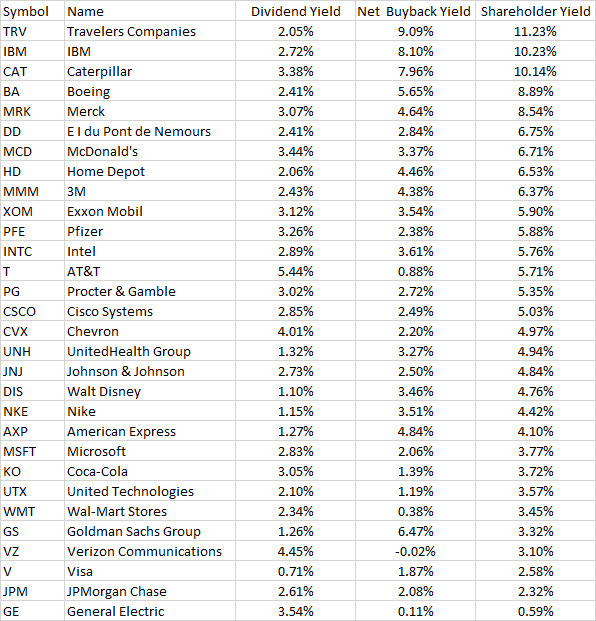
I’ve been writing for a long time as to why a shareholder yield approach is better than a simple dividend approach. (Here’s an old 2007 post.) Below we take a look at the 30 stocks in the Dow for a simple example.
Dividend yields on the group range from 0.7% to 5.4%, with the “Dogs” (top 10) averaging 3.7%. Tack on their buyback yield and you end up with an average shareholder yield for the entire Dow of 5.5%.
However, if you instead sort on shareholder yield (here just dividends and net buybacks), you end up with a dividend yield of 2.7%, but a total shareholder yield of 8.13%. I would rather have the latter portfolio, wouldn’t you?
Full chart below courtesy of YCharts, which I forgot I had a subscription to. Nice site though. Click to zoom in.


