This excerpt is from the book Global Asset Allocation now available on Amazon as an eBook. If you promise to write a review, go here and I’ll send you a free copy.
—-
“We have a passion for keeping things simple.” – Charlie Munger, Vice-Chairman Berkshire Hathaway
Why not just invest along the weightings of the global market cap weighted portfolio? The main difficulty is that it is hard to determine exactly what the exact weightings are, but a number of researchers have come pretty close with a ballpark estimate.
A paper titled “Strategic Asset Allocation: The Global Multi-Asset Market Portfolio 1959-2011” breaks out the broad world market portfolio.
Credit Suisse also looks at the global portfolio, and Figure 30 breaks out their allocations.
FIGURE 30 – The Global Market Portfolio, (“GMP”)
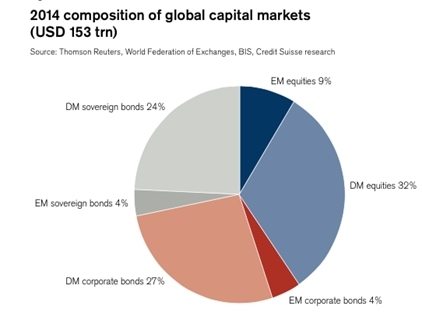
Source: Credit Suisse, Global Wealth Databook 2014
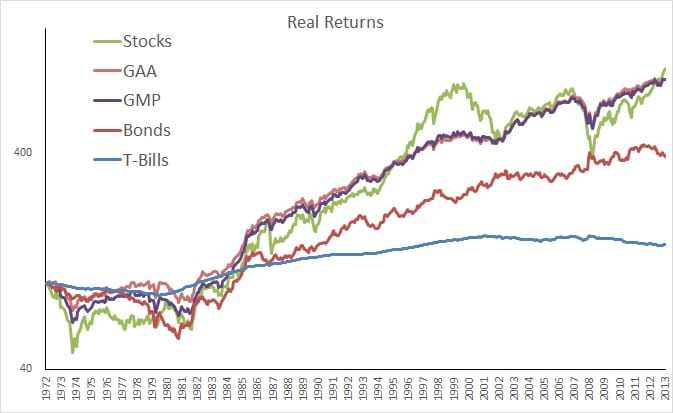
We simplify this to the below allocation (Figure 31), labeled “GMP” for Global Market Portfolio, to see how this portfolio performed. Note: This does not reflect the exact global market portfolio over time since it is estimated from today’s weightings – but it should be a close approximation. It is interesting to note that the true global market portfolio would never rebalance – talk about a lazy portfolio.
FIGURE 31 – The Global Market Portfolio, (“GMP”)
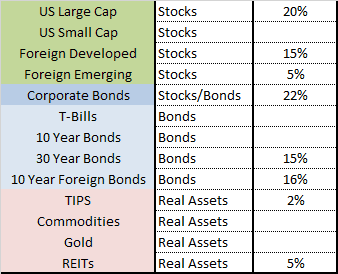
FIGURE 32- Asset Class Returns 1973-2013
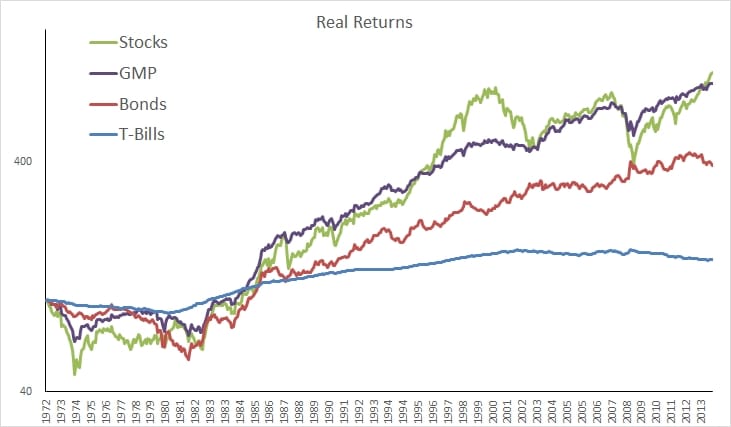
Source: Global Financial Data
We don’t include commodities in this portfolio since it is difficult to estimate market composition, but we believe they provide a vital portfolio diversification element. So what if you altered the above global market portfolio to include commodities? In this case, we’re ball-parking a reasonable number, and we add a 5% allocation each to commodities and gold, and reduce the other allocations proportionally. We will call this portfolio the Global Asset Allocation or “GAA” portfolio. The results were not hugely different, though risk-adjusted returns did improve, as did the consistency.
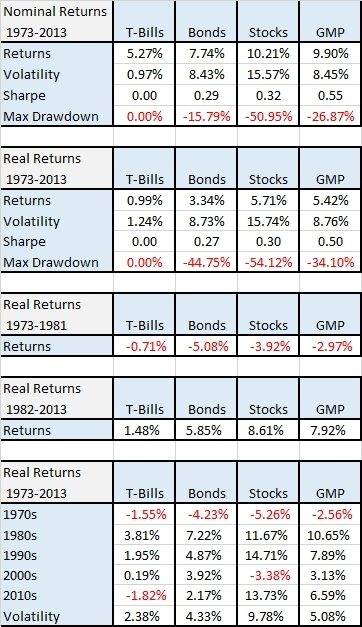
FIGURE 32b- Asset Class Returns 1973-2013
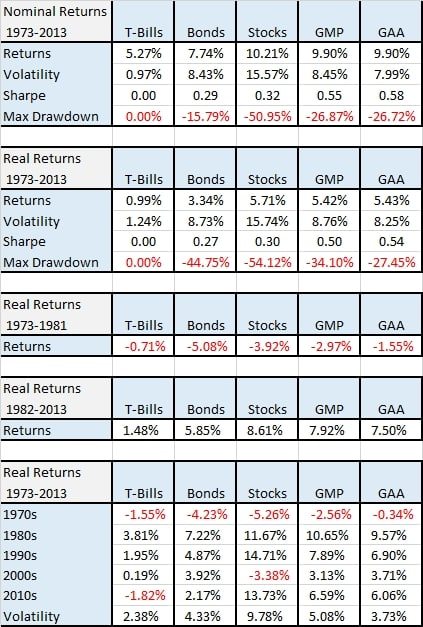
Source: Global Financial Data
