Lots of commentary lately on the CAPE ratio (here are recent articles by Arnott, Swedroe, GMO, and Miller).
I’ve written a book, a white paper, and countless blogs on the topic of the CAPE ratio so I don’t feel the need to rehash a lot of that here as there is plenty in the blog archives. (But it is working great so far in 2016).
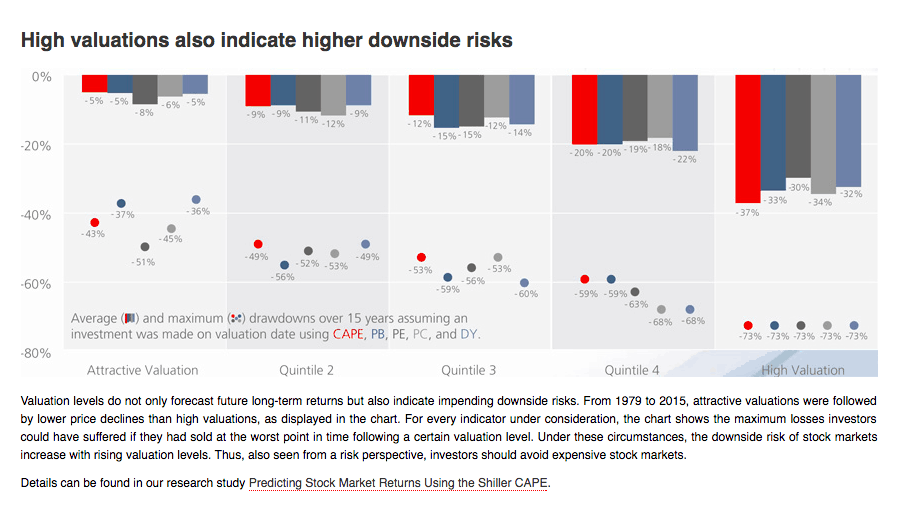
One of the best researchers that has a handle on valuation and using the CAPE ratio is Norbert Kremling at Star Capital. I sent out this PPT of his to The Idea Farm list a few weeks ago and thought I would share this chart below.
It demonstrates how buying expensive assets, as measured using all sorts of valuation indicators including the CAPE ratio, results in bigger losses in the future. I’ve always said valuation is a blunt tool. So I often say, fine don’t use the CAPE ratio as most of the value indicators should be in agreement.
And most are right now – and they say the same thing.
US stocks expensive.
Foreign cheaper.
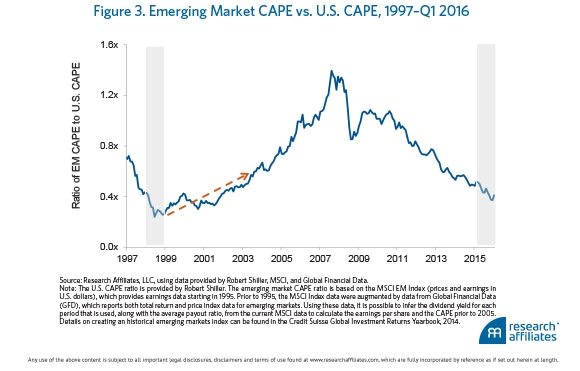
Emerging cheaper-er. (See RA chart at end).
And the cheapest countries are some of the cheapest they have ever been.