If you’re like most investors, you’re asking the wrong questions.
I was chatting with a group of advisors this week down in La Jolla and a question arose. I’ll paraphrase:
“Meb, thanks for the talk. We get a steady stream of salespeople and consultants in here hawking their various asset allocation models. Frankly, it can be overwhelming. Some will send us a 50-page report, all to explain a strategic shift from 50% equities to 40%. I want to do right by my clients, but I have a hard time reading all the various research pieces and models, let alone reconciling their differences. Any thoughts?”
The advisor followed up by emailing me this summary of all of the institutional asset allocation models by the Goldmans, Morgan Stanleys, and Deutsche Banks of the world. And as you’ll see, they are HIGHLY different. Morgan Stanley says only 25% in US stocks, while Silvercrest says 54%! Brown Advisory says 10% in emerging markets and JPMorgan 0%.
Click to enlarge:
Returning to the advisor’s question, if you know me, you’re aware that of course I have some thoughts on the topic! In fact, I wrote a book on asset allocation, and would happy to send you a free copy (go to freebook.mebfaber.com to download).
So what is an advisor to do? What’s the most effective asset allocation model?
Turns out, that’s actually, that’s the wrong question. The correct starting question is, “Do asset allocation differences even matter?”
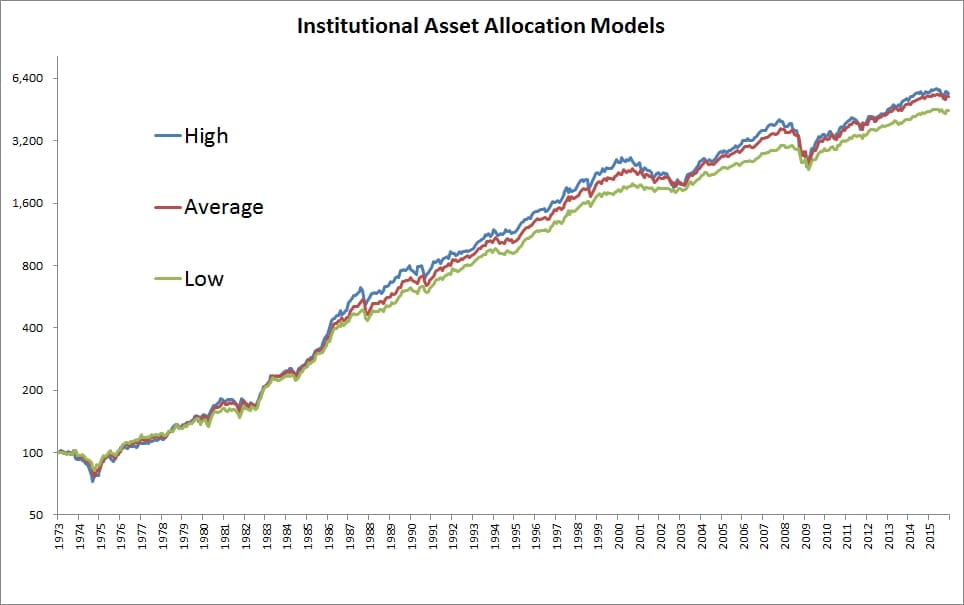
In the summary article which the advisor sent me, there’s a link to a data table showing the asset allocations of 40 of the nation’s leading wealth management groups. Below, my analyst Jonathan and I teased out all the data from the table to examine three allocations:
- The allocation with the most amount in stocks (Deutsche Bank at 74%).
- The average of all 40.
- The allocation with the least amount in stocks (Atlantic Trust at 44%).
Below is the equity curve for each. Unless you have hawk-like vision, you’ll likely have a hard time distinguishing between the curves, and this is for the most different. The other 40+ firms live somewhere in the middle!!
Below are the returns for each allocation over the entire 1973-2015 period.
Most aggressive (DB): 9.72%
Average: 9.60%
Least aggressive (AT): 9.19%
There you have it – the difference between the most and least aggressive portfolios is a whopping 0.53% a year. Now, how much do you think all of these institutions charge for their services? How many millions and billions in consulting fees are wasted fretting over asset allocation models?
Let’s try one more experiment…
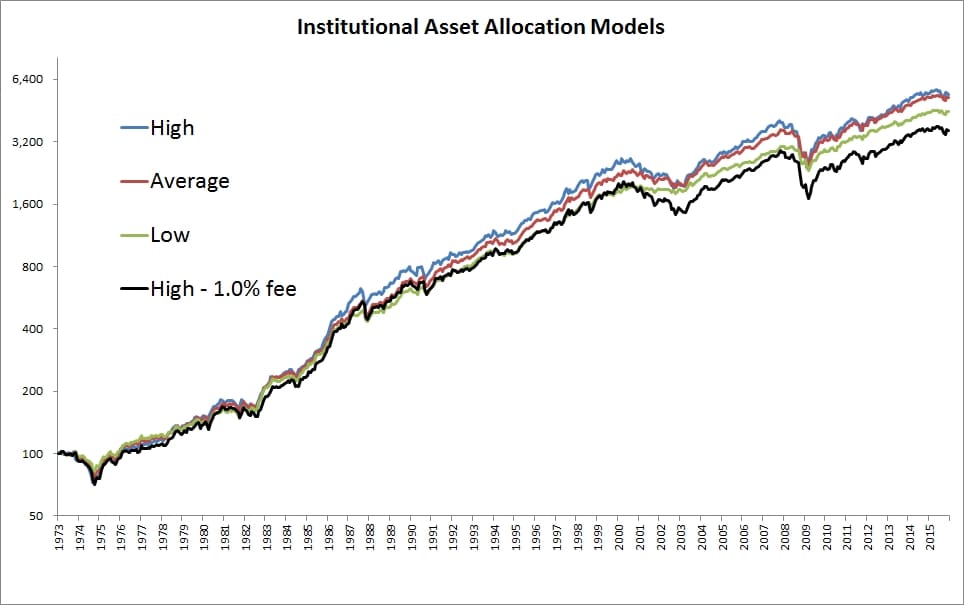
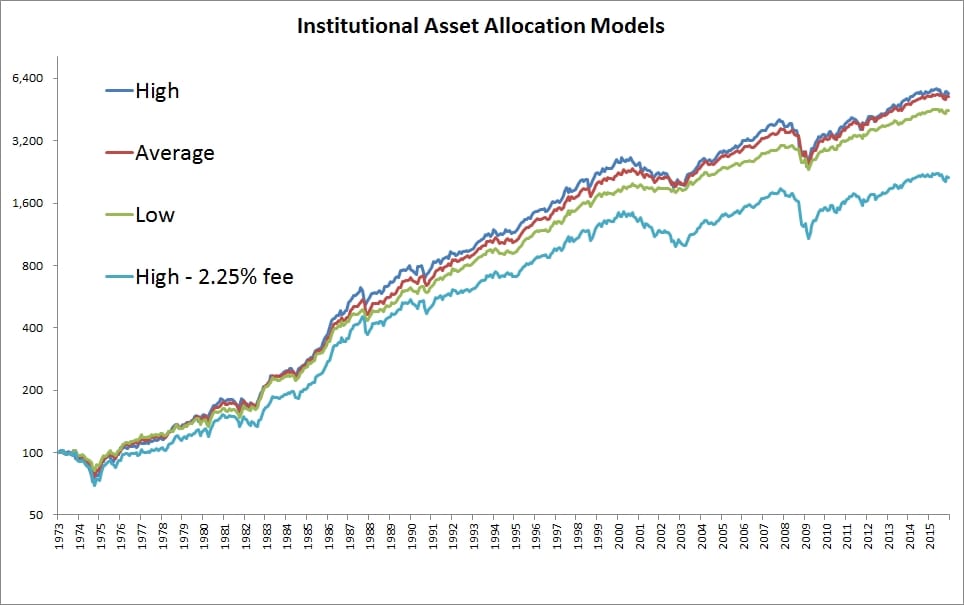
Overlay a simple 1% management fee on the most aggressive portfolio and look again at the returns. Simply by paying this mild fee (that is lower than the average mutual fund, by the way) you have turned the highest returning allocation into the lowest returning allocation – rendering the entire asset allocation decision totally irrelevant.
And if you allocate to the average money manager with an average fee (1%) that invests in the average mutual fund, well, you know the conclusion.
This is one reason my company launched the first, and still only, ETF with a permanent 0% management fee. It owns a handful of other ETFs and all-in fees are 0.29%. For your core buy-and-hold allocation, you (or your clients) should pay as little as possible.
So all those questions that stress you out…
“Is it a good time for gold?”
“What about the next Fed move – should I lighten my equity positions beforehand?”
“Is the UK going to leave the EU, and what should that mean for my allocation to foreign investments?”
Let them go.
If you’re a professional money manager, go spend your time on value added activities like estate planning, insurance, tax harvesting, prospecting, general time with your clients or family, or even golf.
If you’re a retail investor, go do anything that makes you happy.
Either way, stop reading my blog and go live your life.


