When the tech bubble collapsed back in 2000, the Nasdaq fell from 5,132 to just 1,470 a few months later. Many popular stocks found their market prices gutted. For example, Cisco lost 86% of its market cap, while Amazon fell over 90% from $107 to $7. Losses such as these decimated investor portfolios.
In 2008, it happened again. The average diversified U.S. stock fund fell a whopping 38 percent. The S&P 500 lost 50% by March 2009, and investors with more than $200K lost more than a quarter of their savings on average.
Why bring up these bad memories today?
Well, as we get closer to the end of this bull market, whenever that be, many investors are wondering two things: 1) will “whatever’s next” be as bad as 2000 and 2008, and 2) if so, is there a way to avoid it?
No one knows exactly how far the markets will drop when this bull finally runs out of steam; yet, fortunately, there are many strategies one can implement as defense.
First, you don’t have to invest 100% in stocks. We often say the best way to hedge a risk is to not take the risk in the first place. No one says you have to own equities, and cash and bonds are an acceptable “sleep at night” choice. So instead of 100% in stocks, investors could own 80%, or 60%, or even less with the remainder in cash or bonds.
Second, you don’t have to limit yourself to only U.S. markets. This choice is a no-brainer. We’ve spoken often over the past few years about how moving into cheaper foreign equities is a wise choice in a world dominated by more expensive U.S. shares. Particularly, we believe moving into the cheapest markets by long term valuation metrics could still potentially deliver double digit returns going forward. Additional diversification into foreign bonds, and/or real assets like real estate and commodities historically does a great job of helping to lower overall portfolio volatility and drawdowns. It does not guarantee protection, but on balance, it helps.
Third, you could add liquid alternatives. Incorporating strategies like trend following and managed futures, or long-short and market neutral equity, can also help to hedge equity risks.
Now, most investors are familiar with these three choices. But there’s a fourth one we’re going to cover in this article – and while it too is defensive, if used tactically, it can also be an offensive strategy.
To be clear, it’s not for everyone. It’s probably also not for “all the time.” That said, when used wisely and strategically, it has the ability not only to help protect a portfolio during drawdowns, but actually to profit from it.
In the following article, to help contextualize this strategy, we’ll start by providing historical numbers from a variety of different asset classes that are generally considered hedging vehicles. After that comparison, we’ll look at how this strategy performs when added as a permanent fixture in a portfolio.
Let’s jump in.
Getting Some Context – Asset Class Returns in Brutal Markets
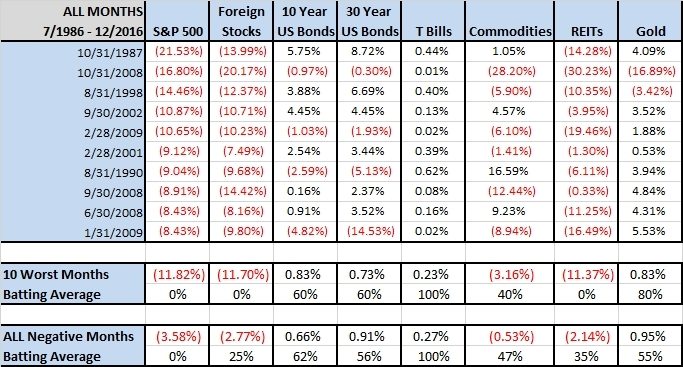
First, let’s start with the bad times. In the chart below, we evaluate the 10 worst months in the S&P 500 since July 1986. U.S. stocks averaged a -11.8% return in those months. The worst month, of course, was October 1987 when stocks fell 21.5%!…ouch! (And by the way, if you extend this analysis back to 1900, the average of the worst 10 U.S. stock months is closer to -20%…)
In the below table, we include some of the main global asset classes. What you’ll find is that there’s a wide discrepancy in the extent to which the asset classes held up – or didn’t – in nasty, down months for U.S. stocks.
For example, note how a few asset classes performed equally bad during those times, including foreign stocks, commodities, and REITs.
Also note T-bills, 10-year government bonds, and gold. We’ll comment on those below.
FIGURE 1: The Worst U.S. Stock Market Months Since 7/1986
Click to enlarge
Source: (Meb Faber/GFD)
T-bills had a great batting average, positive in all ten months, but offered little diversification benefit with average returns of 0.2% in those 10 months.
10-year government bonds were slightly better, with average returns of 0.8% but only positive in six of ten months.
Gold had similar returns of 0.8% and a good batting average of 80%, but also had a terrible month (-16.9%) to coincide with the second worst stock return month (-16.8%). So, hedging is not guaranteed.
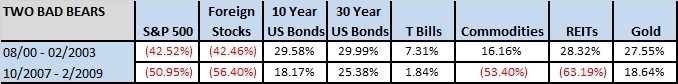
Let’s see how all of these various investments performed during longer periods, namely the two big bears in the U.S. since 2000. These bears saw declines of 42.5% and 50.9%. Brutal!
In the table below, notice how foreign stocks had equally bad performance as U.S. stocks. Commodities and REITs held up during the first bear, but collapsed during the second. T-bills had positive, but muted returns, and gold shone nicely. U.S. 10-year bonds also had nice returns of 29.6% and 18.2% across the two bears.
FIGURE 2: The Two Most Recent Bear Markets
Click to enlarge
(Source: Meb Faber/GFD)
So clearly, some of these asset classes did help in bear markets, but I think we can do better. Let’s reveal the strategy that’s potentially going to help us.
Implementing A Defensive Strategy
The “defensive-but-also-potentially-offensive” strategy centers around buying put options. If you’re unfamiliar with options, it’s beyond the scope of this article to dive into them in detail, but there are plenty of great educational resources out there that can get you up to speed.
The basic idea is that if the market (or your stocks) rolls over, a put option you’ve previously purchased will enable you to either sell your equities at the pre-determined strike price (play defense), or if you don’t own the underlying investment, you’ll be able to profit as the underlying’s market price falls, therein increasing the value of the put you own (play offense).
We refer to this as a “tail risk” strategy. The name comes from the statistical distribution curve, where extreme events tend to occur in either “tail” of the curve. In our case, we’re looking to protect ourselves from those extreme market drawdowns that exist in the far left-side of the distribution curve’s tail.
For simplicity sake, and since the data is public, the tail risk strategy we will utilize is one that buys monthly 5% out of the money options on the S&P 500. We then invest 90% of the portfolio in 10-year U.S. government bonds. (Note: while we sourced the data from the CBOE, this is a different strategy than the CBOE S&P 500 5% Put Protection Index (PPUT) that holds a long position in the S&P 500 Index. We have also replicated numerous variants with our own datasets but elected to publish with the CBOE data since it is public…)
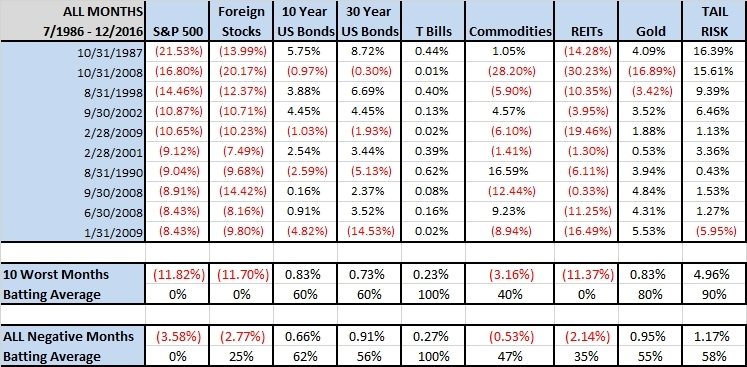
So, let’s now add this tail risk strategy to our earlier comparison to see how it measures up.
Notice in the table below that a simple tail risk strategy had a nice 90% batting average and the highest return at 4.9% during the worst stock months. The only reason it was not 100% was the #10 month of 1/2009.
FIGURE 3: A Tail Risk Strategy Outperforms in the 10 Worst Months Since 1986
Click to enlarge
(SOURCE: Meb Faber/GFD/CBOE)
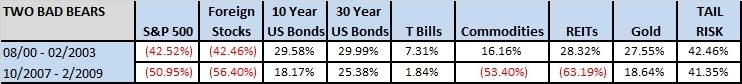
We find similar behavior during long bear markets. As the chart below shows, a strategy of buying puts was the best hedge to a traditional U.S. stock-centric portfolio.
FIGURE 4: A Tail Risk Strategy Outperforms in Our Last Two Bears
Click to enlarge
(Source: Meb Faber/GFD)
The takeaway seems pretty clear: Our tail risk strategy produces strong relative returns during bad months and bear markets. Great! So just send me a crystal ball to let me know when those are going to occur…ha!
That’s the challenge. We have to examine the good times as well as the bad.
Buying Puts – Is It Worth It?
The tail risk strategy provided the best returns, hands-down. But remember, this strategy comes at a cost. You’re paying for the protection. That means investing in a tail risk strategy has some similarities to purchasing insurance.
If the market doesn’t roll over during the life of the put option you’ve purchased (increasing its value), then the money you spent purchasing those puts will go down the drain, dragging down your overall portfolio returns.
So, the big question is “do the strong returns in bear markets balance out the poor returns in rising markets?” Does the insurance premium cover the cost of insurance?
In a flat-to-rising market, we expect a tail risk allocation of U.S. government bonds and S&P 500 put options to produce muted, flat, or even negative yearly returns. As just mentioned, this will likely be a drag on overall portfolio returns.
Therefore, to try to examine this beyond the theoretical, in the chart below we add a tail risk allocation to a U.S. stock portfolio. This is assuming this allocation is added permanently – buy-and-hold and rebalanced.
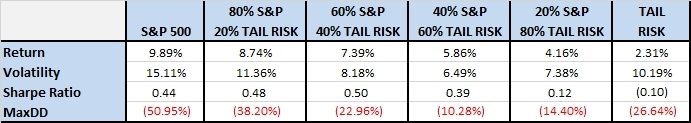
In the chart below, we reference this as Tail Risk and provide four different options for the percentage amount of puts one might add to a portfolio.
CHART: How Adding a Permanent Tail Risk Strategy Affects Portfolio Returns (06/1986 – 12/16)
Click to enlarge
(SOURCE: Meb Faber/GFD)
So what’s your takeaway as you examine these returns?
I showed this to several people in our office, and one of the responses was “The put strategy doesn’t increase returns at all. None of the iterations provide better returns than the S&P, so why not just go buy-and-hold S&P.”
That’s an understandable reaction – it might even be yours – but let’s challenge it.
As any investor who’s had money in the market for a while knows, it can be incredibly painful to watch your portfolio balance being gutted each month during a bear market. Seeing significant losses affects our psyche, and oftentimes leads us to make foolish investing decisions.
In bull markets, we like to think that we’re somehow smarter than average, or more in control of our emotions, but when we’re awash in a sea of red, our rational mindset tends to crumble…fast.
So when we look at any market strategy, it’s important to investigate not just the longer-term average returns, but certain measures of volatility – specifically, the standard deviation and the max drawdown (MaxDD). After all, what good is a fantastic longer-term average return, if you sold at the low point of a drawdown because you couldn’t handle it?
With this in mind, look again at the chart, now paying special attention to volatility and max drawdown.
See how much improvement adding the permanent tail risk strategy offers?
Lower drawdowns are much easier to stomach, and in a real-world setting, would do a vastly better job at preventing panic-selling. Given this perspective shift, I would argue the permanent hedge does help, despite the costs involved, because it’s more likely to keep your money invested, working for you.
However, while these results are interesting, they could be filed under the category of somewhat uninspiring. The Sharpe Ratio of our tail strategy (implemented permanently) ends up in basically the same place as boring old 60/40. And if you add too much tail insurance it starts to actually hurt.
Where Do We Stand Now?
Currently, we are in one of the longest bull markets of all time, with lofty stock market valuations, and a low volatility environment. It may be a prudent time to allocate to a tail risk strategy.
A financial advisor or investment company may even consider purchasing a tail risk strategy. Why you ask? For the same reason airlines hedge fuel costs, and Starbucks hedges the price of coffee.
We wrote about this in my recent post, “A Risky Stock Market for Retail Investors is 4X as Risky for Advisors”. Simply put, a falling stock market negatively impacts only the investment portfolio of the average individual investor. Yet for advisors, it impacts their personal portfolio, their shorter-term business income, potentially their longer-term business income, and in dire situations, the viability of their company. Many investors can reduce their equity exposure, but many advisors and investment companies cannot.
Given this heightened sensitivity, it may be more appropriate for an advisor to purchase a tail risk strategy, therein hedging its business revenues, than it might be for the average individual investor.
There are so many additional avenues for research here.
Perhaps we can identify times when tail hedging is more appropriate – could that be times when stocks are expensive? And if so, at what level? Does extending the maturities of the puts offer a better match with long term holders than one month options? Do low, or high VIX levels affect the strategy’s efficacy? Is there an ideal strike price to target? Are there other money management strategies that could avoid buying insurance when they are very expensive? Perhaps the best strategy of all is to be writing, rather than buying the options at various times?
We look forward to examining many of these topics in the coming years, and if you complete any interesting research on your own, please reach out to share!
