Cambria Fund Profile Series – Cambria Global Value ETF (GVAL)

![]()
![]()
![]()
![]()
![]()
Host: Meb Faber is Co-Founder and Chief Investment Officer of Cambria Investment Management. Meb has authored numerous books, whitepapers and blog posts, and is the host of The Meb Faber Show podcast.
Date Recorded: 9/7/2020 | Run-Time: 14:42
Comments or suggestions? Email us Feedback@TheMebFaberShow.com or call us to leave a voicemail at 323 834 9159
Interested in sponsoring an episode? Email Justin at jb@cambriainvestments.com
Summary: In today’s episode of the Cambria Fund Profile Series, Meb discusses the Cambria Global Value ETF (GVAL).
Meb walks through why it’s important for investors to consider valuations in their process, and how investors can be thinking about portfolio positioning given stock market valuations around the world. He offers a historical perspective on market valuations through the lens of the Shiller PE ratio, often referred to as the Shiller CAPE ratio.
He covers the home bias phenomenon, which shows that investors tend to invest more heavily in their home countries. He talks about why this bias should be avoided, and that going back to 1980, US and foreign stocks have traded at similar valuations. He goes on to point out that, from a valuation perspective, no specific market is any more special and deserving of a long-term valuation premium than any other.
As the episode winds down, Meb walks through the portfolio construction process of the ETF.
All this and more in this Cambria Fund Profile Series episode, featuring the Cambria Global Value ETF (GVAL).
Links from the Episode:
- 0:34 – Intro
- 2:02 – Cambria Global Value ETF (GVAL)
- 2:27 – Historical look at market valuations
- 2:46 – S&P 500 CAPE ratio
- 3:09 – Global market valuations
- 4:38 – Starting CAPE ratios and subsequent returns
- 6:08 – Looking internationally for more attractive equity market valuations
- 6:25 – Home country bias
- 6:42 – Equity market home bias by country – Vanguard
- 9:36 – Cambria Global Value ETF (GVAL) – fund methodology and portfolio construction
- 12:36 – Disclosure
Transcript:
Welcome Message: Welcome to The Meb Faber show where the focus is on helping you grow and preserve your wealth. Join us as we discuss the craft of investing and uncover new ideas, all to help you grow wealthier and wiser. Better investing starts here.
Disclaimer: Meb Faber is the co-founder and chief investment officer at Cambria Investment Management. All opinions expressed by podcast participants are solely their own opinions and do not reflect the opinion of Cambria Investment Management or its affiliates.
Intro: Howdy podcast listeners, we have a little bit of a different show for you today. Over the past decade, we’ve made an effort to educate our clients and investors, now over 40,000 strong, by publishing research and commentaries across the blog, academic papers, books, speeches, and now in the more modern social world, Twitter, YouTube, and this podcast. However, we still get many great questions every day about our funds, many of which are broadly similar, so we wanted to try and use this platform to help educate shareholders as much as possible. You know, Sometimes the spoken word provides a little more context and narrative than just an academic paper or factsheet. And as always, the most important thing in investing is finding an approach that works for you, which may or may not involve any of our funds, which is totally fine. We just want our shareholders to be as informed as possible in what they’re invested in. So enough intro, please enjoy today’s episode in our series of fund profiles.
Meb: Welcome, podcast friends.
Today, we have a special episode in which I’m going to be talking about something that’s very relevant to the markets today – valuation.
What do historical data suggest about future returns based on today’s high starting valuations for U.S. stocks?
You may not like the answer.
In this podcast, we’re going to dive into “why?” behind this, as well as a portfolio-positioning you might want to consider in light of these lofty valuations.
As part of the discussion, we’ll talk about the Cambria Global Value ETF, with the ticker GVAL. We think it’s a fantastic option for investors who are concerned that U.S. stocks are simply too richly-valued.
There’s a lot of great details to cover, so let’s just jump straight in.
Most investment research has shown that when people buy an expensive market, they have a higher chance of big fat drawdowns in their future.
But let’s look at the historical numbers behind this so you don’t think it’s just me spouting theories.
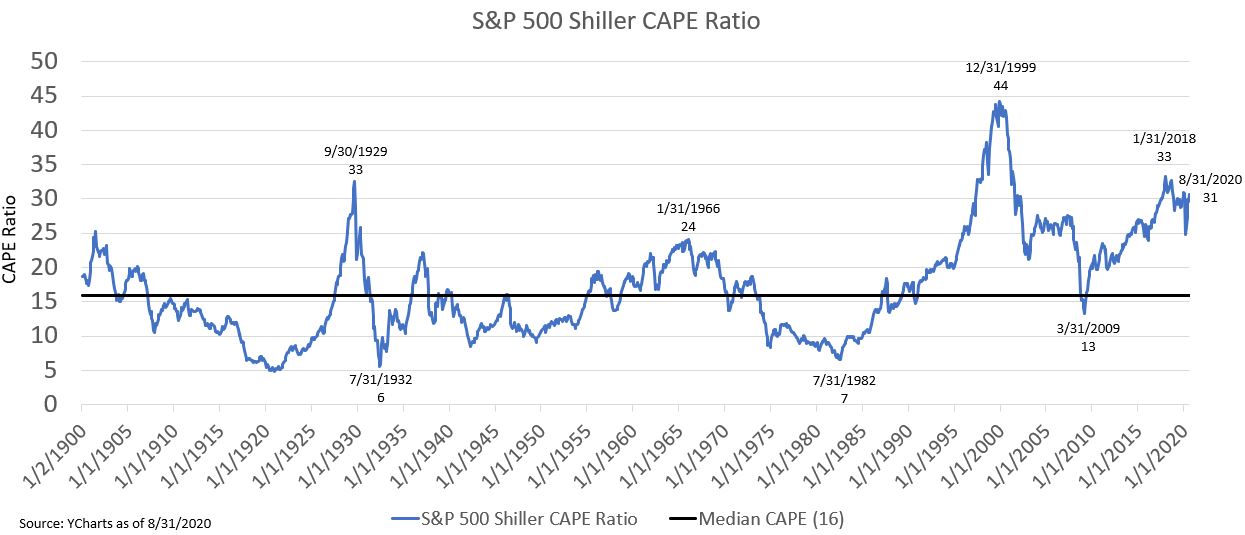
Regular podcast-listeners and readers of my blog know that one of my favorite valuation measures is the Shiller PE ratio, also called the CAPE ratio, which stands for cyclically-adjusted price-to-earnings ratio. In this case, it’s the average of ten-years of earnings adjusted for inflation.
I’ll put a link on our show-notes, but if we look at the S&P 500’s current CAPE ratio reading at the time of this recording, you’ll see that over the past few years it’s been higher than at any other time in the last 150 years with the exception of the Great Depression, the Dot-Com Bubble at the turn of the Millenia.
As I write, the U.S. trades at a long-term CAPE ratio of just over 30.
To give you a sense of how high this is, the median CAPE ratio for 45 countries all around the world is 15. That makes the U.S. level more than double that of the average global country stock market. For perspective, the average for countries over time has been around 17, the US has been as low as 5 historically, and as high as 45 at the peak of the Dot-Com bubble.
Now, the arrogant bullish U.S. investor might say “so what? CAPE levels went through the roof back in 1999 and 2000 while U.S. stocks soared, which made many investors huge returns. So, we have the potential to see similarly-huge gains even from these higher CAPE levels.”
And you’d be right. That’s a fair argument.
But we feel it’s also a dangerous argument, and one that will lose more times than win.
If we look at historical market data, we find that markets tend to revert to the mean readings over time. So, a country that has a high CAPE value today is more likely than not to see its value fall in the coming years. That would mean below-average stock returns.
On the flip side, a country that has a low CAPE ratio value today is more likely than not to see its value rise in coming decade. And that would be based on above-average returns.
The more extreme the starting CAPE ratio value is – either high or low – the more pronounced those 10-year returns often are.
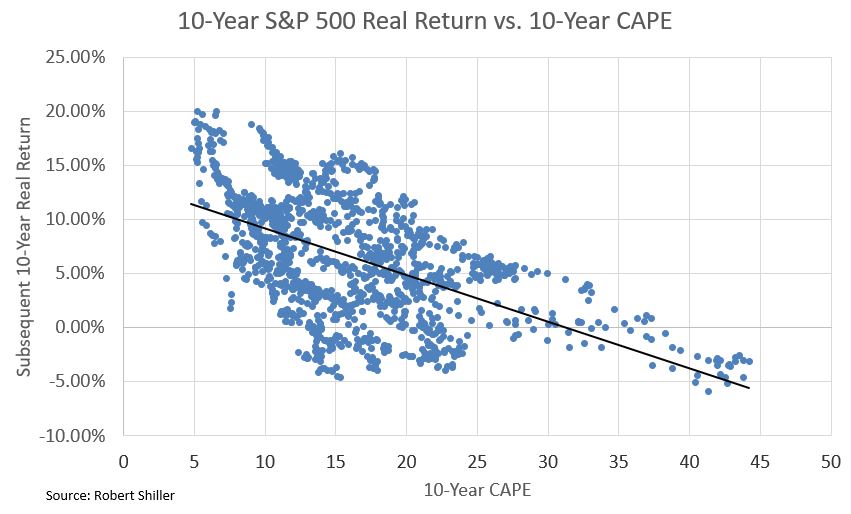
Now, I’m about to reference a chart which we’ll link to in the shownotes, and we have a book called Global Value, which you can download for free on our website.
It shows initial CAPE ratio values and what the subsequent 10-year returns ended up being based on those starting CAPE ratios. The data begins in 1900.
In short, what we find is that initial CAPE ratio values that were low – specifically, below 10, were responsible for the vast majority of 10-year stock market returns averaging 13% or higher.
Meanwhile, initial CAPE ratio values that were high – meaning in the 20-45 range in the U.S., were responsible for the vast majority of 10-year stock market returns below 5%.
In our book, we actually examine this across the global set of all countries as well.
As we just noted a moment ago, as I record this, the U.S. CAPE ratio level is over 30. If we go by this data, that reading does not bode well for the hope of double-digit 10-year returns for U.S. stocks.
To be fair, this correlation between initial CAPE levels and 10-year returns doesn’t always play out in lock-step – but it works enough to be quite helpful to a long-term investor. Think of this tool more as a crude hammer than a precise chisel.
So at this point, we know that our current CAPE ratio level is high, and historical market data suggest that might indicate subdued 10-year returns looking forward.
In response to this, the thoughtful investor would say, “I should rotate out of U.S. stocks then. So, where should I put my money?”
Well, if low starting CAPE ratio values often enjoy higher 10-year average returns, why not simply look around the globe where those low-CAPE markets are?
And that’s our approach. And we believe it’s a fantastic – and very simple – market approach.
Unfortunately, actually doing this proves to be quite hard for the average investor. That’s because most investors are vulnerable to a destructive behavioral tendency called “home country bias.”
As the name suggests, home country bias is the tendency for investors to allocate most of their money to investments in their own country.
But it’s not a uniquely American phenomenon. It happens to investors all around the world.
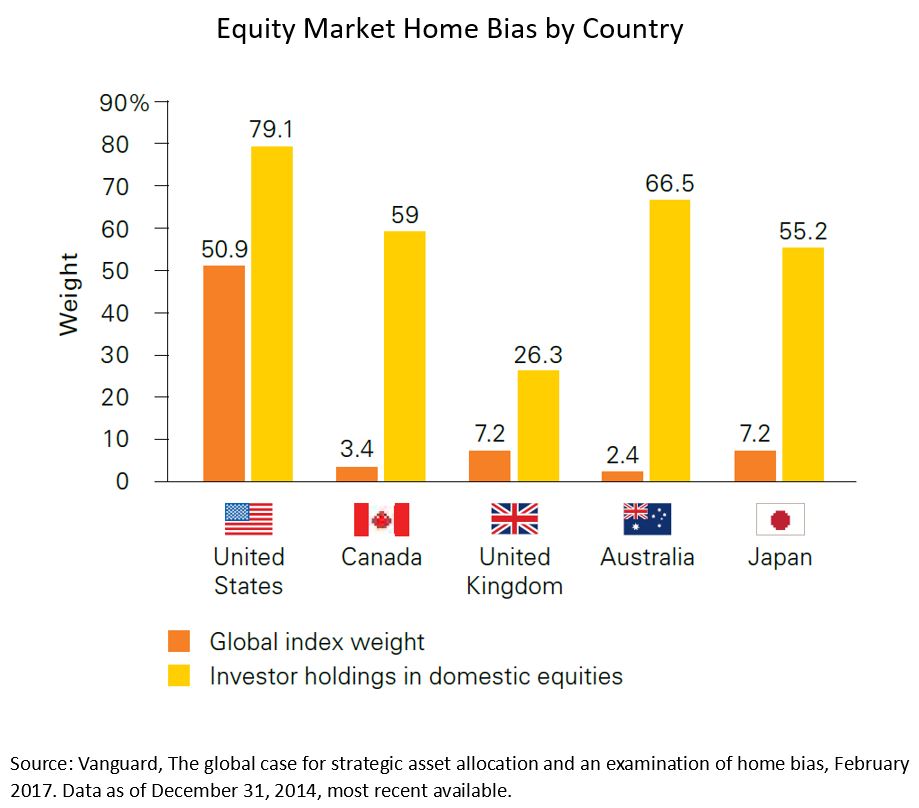
In the shownotes, we’ll include a chart from Vanguard that shows this home country bias at work.
One of the chart’s inputs is a given country’s global index weight. In other words, if we looked at the entire world as one big investment market, how much “weight” should a specific country have within that global portfolio, based on its size?
Large stock markets like that of the U.S. would have a bigger “weight” of the global market portfolio than a smaller stock market, like the one in Australia.
The second variable in the chart shows the percentage of domestic stocks that investors in each country hold in their portfolios.
What you find is, all around the globe, investors put way more into domestic stocks than their own country’s weight deserves.
For example, here in the U.S., we put nearly 80% of our investment dollars into the U.S. market.
And the problem is that the U.S. market can suffer a prolonged bear market just as easy as any other market. You might have forgotten that based on the epic 10-year bull market we recently had, right? But it’s true.
So most people put in around 80% in the U.S. when the global weight is just above 50%. So why not think globally. Well, lots of people have reasons why U.S. stocks deserve much higher multiples, but in fact, going back to 1980, both U.S. stocks and foreign stocks have an average CAPE ratio of around 22. What that means is, historically, the U.S. stock market is no more special than any foreign stock market. And while the full history average for countries over time is around 17, during times of low inflation we do see investors willing to pay a little more of a higher multiple, so up around 21, 22 can be a little more “normal” in times when inflation is mild.
But beyond that, the amount of time the U.S. spends being more expensive than foreign countries, and vice versa, is basically a coin flip. That stat surprises a lot of people who assume that the U.S., which is currently expensive, is always expensive, and must trade at a premium.
So, let’s pause.
What we’ve tried to show so far today is that lofty starting valuations tend to correlate with subdued, underwhelming 10-year future stock market returns. Conversely, low valuations tend to correlate with greater 10-year returns.
The U.S. CAPE level today is over 30, which is quite high on a historical basis. Not as bad as the Dot-Com Boom of 45, but still elevated.
We’ve then tried to show that most U.S. investors are overly concentrated in one market, specifically, the U.S. market – which we believe is dangerous.
Meanwhile, the U.S. stock market has nothing intrinsically special about it. So, investors would be wise to consider opportunities with lower valuations all around the globe if they’re looking to enhance 10-year returns going forward.
We have a great pinned tweet that lists a lot of the top investment research focused on global investing, we’ll add a link to the shownotes, from lots of other well respected firms like Bridgewater.
So, the question then is “what’s a simple, one-click way to access these low valuation stock markets around the globe?”
And that brings us to our fund, the Cambria Global Value ETF. We’ve engineered it to try to capitalize on what we believe is the power of low valuations, regardless of where values are found around the world.
The fund methodology begins by identifying the least expensive stock markets in the world using a composite of long term valuation metrics like the CAPE ratio but we also use others using cash flows and dividends.
It starts with a universe of 45 countries, located in both developed and emerging markets. GVAL then selects the top 25% least expensive country stock markets as measured by those long-term valuation metrics.
We then go one step further and do a bottoms-up analysis using a valuation composite across very similar valuation metrics again, like, price-to-earnings, price-to-sales, price-to cash flow, and enterprise value-to-EBITDA to select the 10 most undervalued stocks out of the top 30 largest stocks by market capitalization within each country.
We believe that part of the benefit of GVAL’s approach is that is has an offensive and defensive component. What we mean by that is, for offense, you’re aligning your portfolio with markets with low valuations, which, in our opinion means strength and a greater chance of elevated 10-year returns.
Current basket of companies have an average CAPE ratio of around 10 versus 15 for the median country, and again, over 30 for the U.S.
So that bottom quartile is almost a single digit valuation, and many of the countries are single digit within it, but on average, it’s around 10, which is two-thirds less than the U.S. is currently, and that’s quite a large margin.
But equally importantly, you’re avoiding the high valuation countries, which we believe correlates with weakness, and are most likely to drag down longer-term returns.
Market historians that are listening will recall Japan hitting a CAPE ratio of almost 100 in the 1980s. And a future multiple decades of poor stock returns followed thereafter.
Based on decades of historical market data, we believe that investing with this global, CAPE ratio-valuation mindset is a powerful way to help increase your long-term returns.
So as we wrap up, I’ll remind you once more that today, long-term valuations in the U.S. using the CAPE ratio, and other metrics, are high. One of the highest readings in the past 150 years.
In our opinion, staying fully invested in the U.S. market today – with a heavy concentration of your portfolio in the market in the U.S. – is at odds with likely probabilistic outcomes based on what history has to offer.
To us, the risk-reward tradeoff simply isn’t worth it.
What is far more attractive, in our opinion, are the low valuation levels available to investors if they look beyond U.S. borders.
If you share this opinion, we’d encourage you to check out GVAL, the Cambria Global Value ETF.
For more information, you can visit CambriaFunds.com or reach out directly at 310.683.5500.
Thanks for listening friends, and good investing,
Disclaimer:
To determine if this Fund is an appropriate investment for you, carefully consider the Fund’s investment objectives, risk factors, charges and expense before investing. This and other information can be found in the Fund’s full and summary prospectus which may be obtained by calling 855-383-4636 (ETF INFO) or visiting our website at www.cambriafunds.com. Read the prospectus carefully before investing or sending money.
The Cambria ETFs are distributed by ALPS Distributors Inc., 1290 Broadway, Suite 1000, Denver, CO 80203, which is not affiliated with Cambria Investment Management, LP, the Investment Adviser for the Fund.
A Few Quick Definitions:
Shiller CAPE ratio: The cyclically adjusted price/earnings ratio is the price of a security of equity index divided by the average inflation-adjusted earnings over the past 10-years.
The S&P 500 Index: An index of 500 U.S. stocks chosen for market size, liquidity and industry grouping, among other factors. The S&P 500 is designed to be a leading indicator of U.S. equities and is meant to reflect the risk/return characteristics of the large cap universe.
Valuation: The theoretical value (or monetary worth) of an asset, often times referenced in comparison to another asset, group of assets, or an asset’s own history.
On July 1, 2020 the Cambria Global Value ETF changed its investment objective and investment strategy. The fund changed from being passively managed to actively managed on that date.
GVAL seeks income and capital appreciation
Past performance is not indicative of future results
Shares are bought and sold at market price (closing price) not net asset value (NAV) are not individually redeemed from the Fund. Market price returns are based on the midpoint of the bid/ask spread at 4:00 pm Eastern Time (when NAV is normally determined), and do not represent the return you would receive if you traded at other times. Buying and selling shares will result in brokerage commissions. Brokerage commissions will reduce returns.
There is no guarantee that the Fund will achieve its investment goal. Investing involves risk, including the possible loss of principal. International investing may involve risk of capital loss from unfavorable fluctuations in currency values, from differences in generally accepted accounting principles, or from economic or political instability in other nations. In emerging markets, all these risks are heightened, and lower trading volumes may occur. Investments in smaller companies typically exhibit higher volatility.
There is no guarantee dividends will be paid. Diversification may not protect against loss.
There are special risks associated with margin investing. As with stocks, you may be called upon to deposit additional cash or securities if your account equity declines.
