Monthly Archives: November 2006

Great Website

Fundadvice.com has a plethora of articles on buy-and-hold investing, as well as market timing.

A couple of my favorites:

Buy and Hold Articles
The Ultimate Buy and Hold Portfolio
The Perfect Portfolio

Market Timing Articles
All About Market Timing
Market Timing: The Rest of the Story
Do You Have What it Takes to be a Successful Market Timer?

Lots more info on there for retirement, etc. . .

Simple Cross-Market Momentum

Below I will present a simple quantitative method that exploits momentum in relative returns across a wide set of asset classes. The strategy is examined since 1972 in an allocation framework utilizing a combination of diverse and publicly traded asset class indices including US Stocks (S&P 500), Foreign Stocks (MSCI EAFE), Commodities (GSCI), REITs (NAREIT), Cash (90-Day Commercial Paper), and United States Government Bonds (10-Year Treasury Bonds).


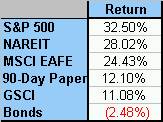
The most simple measure of momentum I can think of (and the one cited in the GS primer) is trailing 12-month absolute returns. To make matters even simpler, and improve the tax consequences, the system will only update once every year at year end. You begin with a simple ranking of absolute performance – the example to the right is year end 1980:

Your holdings for the next year would be ranked in that order, with US Stocks at the top, and Bonds at the bottom. How has this simple ranking performed? From 1973 (Had to use 1972 at the first year for ranking) through 2005, and equal weighted portfolio of the 6 asset classes above, rebalanced yearly would have returned a respectable 11.16% p.a.

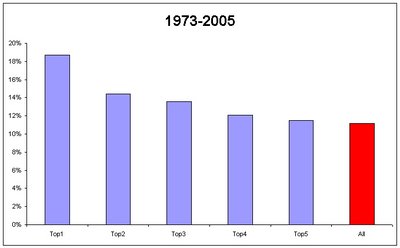
However, as evidenced in the chart below, the top performing asset class (#1) had a one-year subsequent performance of 18.73%. Almost a doubling of annual return, albeit with much more volatility and a higher negative year. #2, #3 etc all represent the following years performance for the #2, #3 best ranked absolute performance. ie in 1980, the #3 best performer was foreign stocks (MSCI EAFE) at 24.43%. You would then be long MSCI EAFE in the #3 bucket for 1981. . .It is interesting to note that buckets 4-6 all underperform the portfolio, evidence of momentum on the downside as well.

If you can’t read the Table, here is a chart of the returns. . .While it is not the perfect stairstep down one would prefer, you do see the general trend of declining returns from bucket #1 to bucket #2.
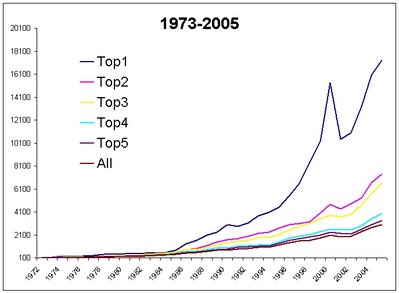
Although 18.73% returns are spectacular, some investors might not be able to handle the risk involved in investing in only one asset class. The Top 2 and Top3 portfolios (holding the top 2 and top 3 asset classes, equally weighted) each outperform the benchmark (labelled “All” in the chart) on both an absolute and risk adjusted basis.

The optimum risk-adjusted portfolio is the Top 3 asset portfolio, returning over 250 bps more than the equal weighted with slightly higher volatility, and only 2 down years since 1973 – and a worst year of only -(3.64)%.

$100 invested in the 6 asset class portfolio would be worth $3003.03 year end 2005, while $100 invested in the Top1 strategy would be worth $17,333.15.

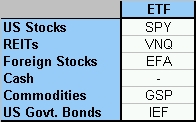
Example ETFs reflecting the asset classes discussed in article are:

Goldman Primer

In the Goldman Sachs GTAA primer linked below, they describe some empirical evidence of GTAA using valuation and momentum factors. They form equal weighted portfolios withing each asset class (equities, fixed income, and currencies) based on 1 – Valuation based on Price to Book (P/B) for equities, yield curve for fixed income, and purchasing power parity for currencies, and 2 – Momentum as measured by 12-month returns.

They form long/short portfolios with equally-weighted long positions in the one third of countries with the lowest valuation (or highest momentum) and short positions in the third with the highest valuation (lowest momentum).

They find that the momentum and valuation effect are robust across all three asset classes.

Historical Evidence

Essentially, GTAA is market timing. Historical evidence has provided a mixed bag of evidence of the ability of market timers. One of the best literature reviews of the subject is “Evaluating a stock market timing strategy: the case of RTE Asset Managment” by Tezel and McManus [2001].

Global Tactical Asset Allocation

The focus on the blog thus far has been a passive buy and hold approach to investing – esentially, how you divy up your pie into slices of world asset classes. However, an active approach to asset allocation may offer some value. Tactical Asset Allocation is defined by Investopedia as an

“active management portfolio strategy that rebalances the percentage of assets held in various categories in order to take advantage of market pricing anomalies or strong market sectors. “

What is that exactly? Three great reviews below:

Global Tactical Asset Allocation – Goldman Sachs
Manufacturing Alpha from BetaIntegra Capital
TAA Comes Back from the Dead – Goldman Sachs

From the Goldman overview:

In essence, GTAA aims to:
• Improve the overall return per unit of risk (information ratio) in a client’s portfolio through active management of asset allocation deviations
• Generate excess returns uncorrelated with traditional sources of active risk • Meet individual clients’ needs and objectives through customized portfolios
• Employ minimal capital with limited disruption to underlying managers

There a couple ways to enact GTAA, and the most common are 1 – value and mean reversion strategies, and 2 – momentum and trendfollowing strategies.

Speaking of Crahses


The Nasdaq Composite since 1972 has had two declines over – 50% (- 58% from 1972-1974, – 75% from 2000-2002). The chart doesn’t look so bad because it is logarithmic. . .

What about the other major asset classes? Below is a table of 5 major asset classes: US Equities, Foreign Equities, US Government Bonds, REITs, and Commodities. Since 1972, total return data. All have had quite substantial drawdowns. . .

Stock Market Crashes

“The first rule is not to lose. The second rule is not to forget the first rule.”- Warren Buffett

How many investors remember the stock market decline of 2000-2002? If you had your portfolio invested in the DJIA, you sat through a ~ -38% decline. Preferred the Nasdaq? You experienced a – 75% decline (sorry to bring up those painful memories). How much does a – 75% decline require to get back above water? 300%. Yikes.

Let’s put the DJIA decline into perspective. Surely the most recent bear market ranks as one of the worst bear markets of the previous century, right? Bad news, there have been 9 declines larger than – 40% (with the worst spot belonging to the 1930-1932 decline, a gut-wrenching – 86%).

That works out to approximately one – 40% decline per decade. While stocks may be the best investment “for the long run“, an investor must be able to be comfortable with losing about half their capital every decade to stay the course in equities.

A list of the top 10 DJIA declines since 1900 here.

Harvard + Yale II

According to the latest updates from the two largest university endowments, Harvard and Yale, the percentages they allocate to various asset classes are located in table below. While the average retail investor does not have access to private equity and hedge funds, he can invest in the remaining five asset classes through publicly traded vehicles like ETF’s and mutual funds. After stripping out the hedge fund and private equity allocations, the remaining asset class allocations were normalized and then averaged between the two universities. The results are a near equal weighting across US Stocks, Foreign Stocks, Bonds, Real Estate, and Commodities.


To investigate how a portfolio of these five asset classes would have performed historically, we assign each a 20% allocation, and rebalance the portfolio yearly. The indices used for backtesting are the S&P 500, Morgan Stanley Capital Markets EAFE Index, 10 Year US Government Bonds, National Association of Real Estate Investment Trusts Index, and Goldman Sachs Commodity Index. All are total return series that are updated monthly. The portfolio is referenced as Asset Allocation (AA), and 40 basis points are deducted for management fees to invest in a representative ETF or mutual fund.

As the table above illustrates, Harvard outperforms the AA portfolio by over 300 basis points, but is also more volatile. The higher volatility and subsequent higher returns are likely due to the inclusion of private equity and hedge funds in the portfolio. On a risk-adjusted basis, the AA portfolio is fairly close to the Harvard endowment with Sharpe ratios of .86 and .99, respectively (using 4% Rf). The S&P500 likewise unperformed the Harvard endowment, and was much more volatile. The worst drawdown for the AA portfolio was a pedestrian –11.24%, while for the S&P 500 it was a whopping –44.25%.

To account for the inherent leverage in many of the hedge funds Harvard might invest in, it is instructional to examine what results of the AA portfolio would be if leverage was applied. Including the cost of leverage at the broker call rate, the returns of the AA portfolio leveraged 1.5 times are very close to the Harvard endowment. Volatility is slightly higher than the endowment, although still less that the S&P 500 and with drawdowns half of the S&P 500. A portfolio leveraged 2:1 would outperform the endowment on an absolute, but not risk-adjusted basis.

Sample ETFs to implement this allocation could be:

US Stocks (VTI, SPY)

Foreign Stocks (EFA)

US Bonds (AGG)

Real Estate (VNQ, IYR)

Commodities (GSP, DBC)

Harvard and Yale Endowments

Harvard University sits atop the academic world with a staggering $25.9 billion endowment fund, nearly twice the size of the next biggest endowment at Yale University. This war chest has accumulated over the years on the basis of donations and the stellar returns recorded by the investment management arm of the endowment, Harvard Management Company (HMC). From 1983 through year-end 2004, HMC has realized returns of approximately 16% per year for the endowment vs. approximately 14.11% for the S&P500.

The star investment manager, Jack Meyer, managed the fund for the previous 15 years and oversaw growth in assets from $4.7 billion to $26 billion – including outperformance equal to an extra $12.2 billion over the typical large institutional fund. Last year he was ousted over a row over excessive compensation. The top six managers of HMC routinely received salary and bonus packages that totaled upwards of $70 – $100 million, and there were many vocal critics within the Harvard administration.

Meyer defended the compensation packages by arguing that they are in line with industry norms. He states, “This compensation deal is a good deal for Harvard. If we had used external managers and gotten the same results, it would have cost twice as much.” Meyer has since set a record with the largest hedge fund launch ever at $6 billion, and convinced 30 former HMC employees to join him at to the new firm. HMC has since tapped PIMCO’s emerging markets bond fund manager El-Erian to run HMC.

The average investor could never hope to compete with a staff of 30 researchers and access to the brightest minds in the business – or could he?

Evidence of the benefits of diversification

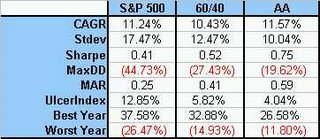
Modern portfolio theory. Lets look at the risk and return figures for 3 asset allocations since 1972.

1. 100% S&P 500
2. 60% S&P500 & 40% 10 Year US Govt Bonds
3. 20% S&P500, 20% Foreign Stocks (MSCI EAFE), 20% 10-Yr US Govt Bonds, 20% REITs, & 20% Commodities (GSCI)

(AA is #3, the asset allocation portfolio). All figures are total return data, including dividends and rebalancing.

As you can see, diversification mainly acts to reduce your risk (although it actually has the highest CAGR of the three as well). A drawdown of 44% for the S&P500 during the 2000-2003 bear market was reduced to a much more manageable 20%.

For a description of he Ulcer Index (low number is better), go here:

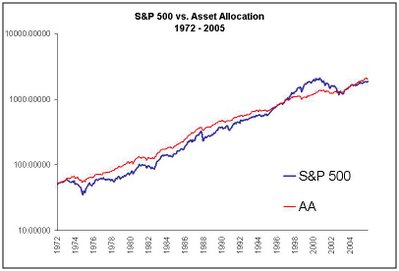
The equity curve pictured here shows the simple effects of a diversified portfolio. An equal weighted 5 asset class portfolio (AA) vs. the S&P500 for the past 30+ years. They both arrive at the same finish line, but one with much less volatility. . .