(This was going to be a longer piece but I’d touch on the highlights below.)
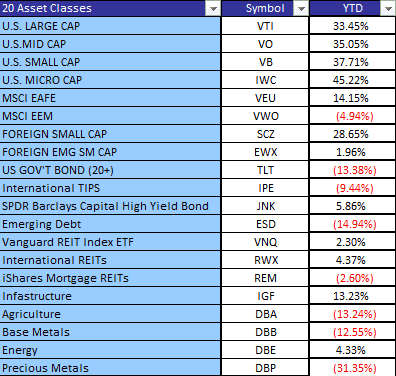
Let’s jump right in – how did broad asset classes perform in 2013? Short answer – a monster year for US stocks, bad for bonds and commodities. Foreign equity markets and real estate were mixed. Below is a representative table of 20 basic ETFs across the broad asset classes:
FIGURE 1 – Asset Class Returns
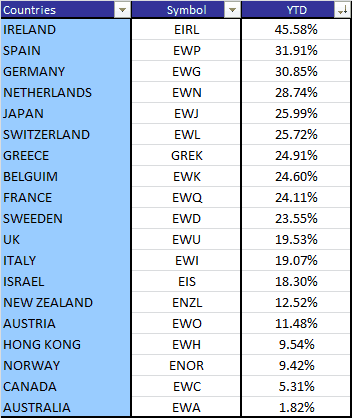
Foreign Developed Stocks:
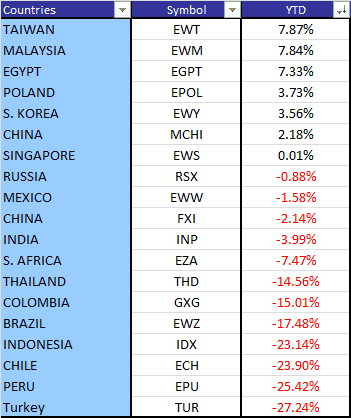
Foreign Emerging Stocks:
Now, on to what to expect in 2014…
1. 2013 – A Monster Year for Stocks…
US equity markets had a banner year in 2013 with the S&P 500 up 32%. While this number sounds large, as Fisher is fond of saying, “normal market returns are extreme”. Below is a chart with the distribution of all US stock returns since 1900. As you can see, most years are positive, but there are certainly some massive outliers on the good and bad side. Fat tails are the norm.
Figure 2 – US Stock Market Returns Since 1900
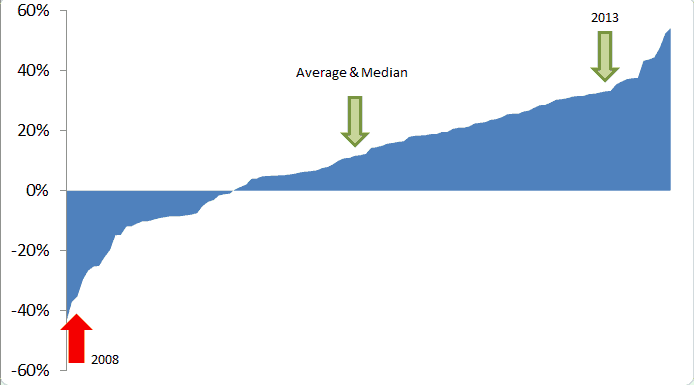
Source: GFD
Even though we have had quite a run since the 2009 bottom, up 179% for US stocks, the past thirteen years have been difficult for most investors
US stocks have returned a meager 3.58% per year from 2000 – 2013, and factoring in inflation, have returned 1.2% per year. That is, if the investors had the ability to sit through two gut wrenching bear markets with declines of over 45%, and according to recent DALBAR studies, many have not. The average equity investor underperformed the S&P 500 by about 4% over the past 20 years. (Bond investors are equally as bad.)
2. …But Valuation Will be a Headwind
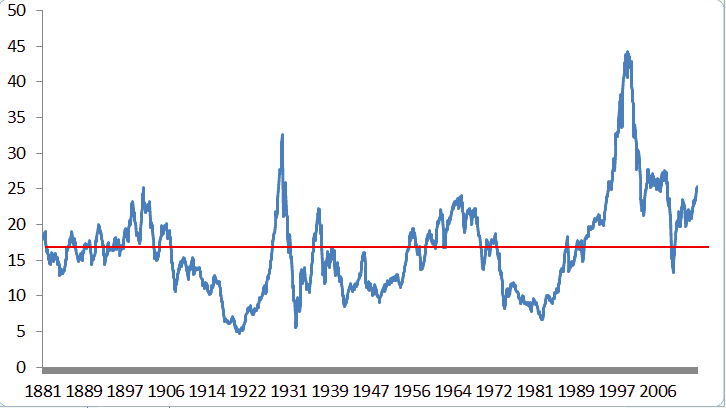
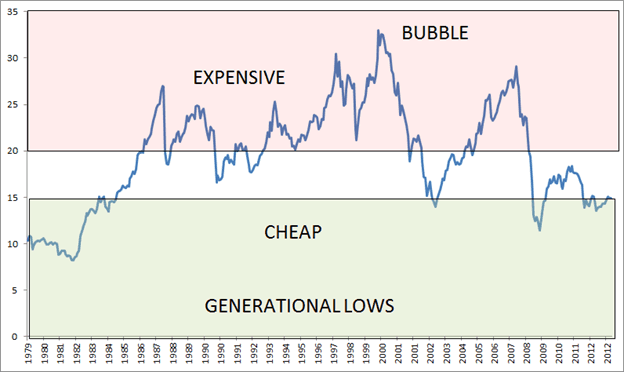
One of the reasons for the subpar returns is simple – valuations started the 2000s at extreme levels. The ten year cyclically adjusted price to earnings ratio (CAPE) reached a level of 45 in December 1999, the highest ever recorded in the US. We are nowhere near bubble territory, nevertheless, stocks are on the expensive side.
FIGURE 3 – 10 Year Shiller PE (CAPE) Values
Source: Shiller
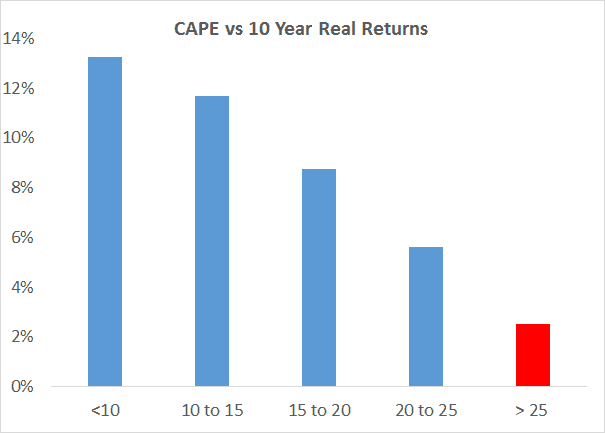
As you can see in the figure below, future returns are highly dependent on starting valuations. The current reading as of the end of 2013 is 25.4, above the long term average of around 16.5. At the current levels of 25+, future returns have been uninspiring.
FIGURE 4 – CAPE and Future Real Returns
Source: Shiller
While many have critiqued the legitimacy of CAPE, realize all of the valuation metrics are in agreement – US stocks are expensive – they just disagree on the magnitude. (Even Siegel’s NIPA measure argues stocks are expensive historically.) While we don’t think we are anywhere near a bubble, returns should be muted going forward. Perhaps 4% nominal is a good target. If margins revert, 0% is a real possibility.
3. Small Cap Stocks and Dividends are Expensive
Small cap stocks had an even stronger year than the broad market in 2013, up 37%. However, this performance has led small caps to be at a high relative valuation to large caps, and a high absolute valuation relative to their own history. Investors should consider a cap agnostic approach or perhaps eliminate small caps altogether.
FIGURE 5 – Small Caps Relative to Large Caps
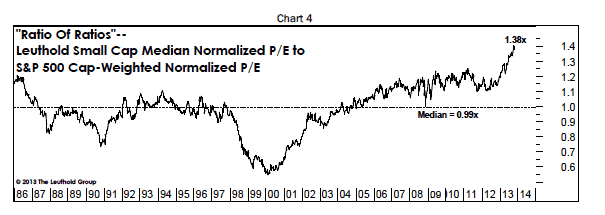
Source: Leuthold
FIGURE 6 – Overall Small Cap Valuations
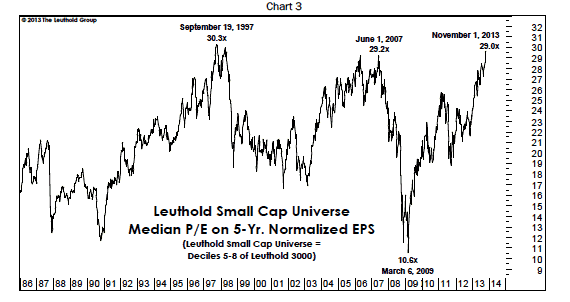
Source: Leuthold
Another area of concern within equities is the high dividend yield space. Historically dividend stocks have traded at a discount to the overall market, but as money has rushed into dividend stocks, the high yielding dividend stocks are trading at a large premium to the overall market.
We feel the same about many low volatility strategies that are no longer trading at low volatility levels…consumer discretionary should also underperform as it finds itself at one of the higher multiples in history on both an absolute and relative basis.
FIGURE 7 – Dividend vs. Shareholder Yield Valuations
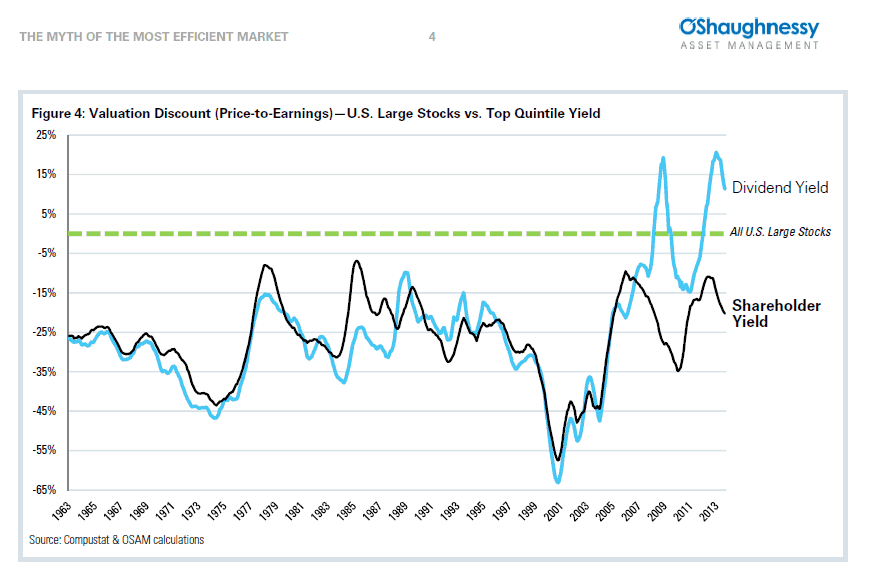
Source: OSAM
4. Bonds will not help a 60/40 get to 8%
US government bonds proved to be a wonderful place to hide out during the past 13 years. The compound return was 5.9% and a nice 3.4% after inflation. The problem with these returns, however, is that they come at the expense of future returns as yields have declined. 2013 proved to be a tough year for bonds, with yields on the 10 year rising to around 3% and the same bonds suffering a 8.6% decline.
Future bond returns are easy to forecast, they are simply the starting yield. Your ten year return for buying US government bonds will be around 3% currently.
So, investors are presented with the following opportunity set (assuming 2% inflation going forward, and rounding to make it simple):
US stocks: 4% nominal, 2% real
US Bonds: 3% nominal 1% real
That leaves a 60/40 investor with a 3.6% nominal return, or a 1.6% real return. Not exactly exciting, and nowhere near 8%!
So where should investors look for outsized returns while managing their risk?
5. Where to Look? Go Global
The European crisis has pushed down many foreign and emerging country stock valuations to low levels. Some countries, like the PIIGS (Portugal, Italy, Ireland, Greece, and Spain), are trading at low CAPE levels below 11 (Greece and Ireland are both below 8). The broad MSCI EAFE is around 16, and the MSCI EEM is around 15. The US is the most expensive developed or emerging country at a value of 25! Nine countries are below a CAPE of 10 and twenty are below a value of 15. It makes a lot of sense, especially for those that are heavily overweight US stocks, to consider a more global approach with an allocation to foreign stocks. The United States only accounts for about 20% of world GDP, and half of market cap, but most US investors have a much higher allocation of around 80% to US stocks (which is what is typical around the world with this home country bias). Most stocks around the world are cheap:
FIGURE 8 – Average Valuations Around the World
We also firmly believe, as central banks continue their fight against inflation, in the strategic allocation to real assets, including real estate through domestic and foreign REITs, and various commodity exposures. A simple allocation of these assets, as detailed in our book The Ivy Portfolio, would have done decent job at navigating the past 13 years of market volatility. While there was a lost decade in US stocks, a balanced global asset allocation performed much better.
SUMMARY
As demonstrated by the returns over the past 13 years, choosing a strong approach to managing assets can make a big difference to a portfolio. Avoiding common mistakes, such as emotional decision making, only focusing on traditional asset classes , and not having a risk management plan, is important. Often investors don’t have the time or the patience to manage their assets effectively. Consider reducing exposure to US stocks (small caps and high dividend yielding stocks) in favor of foreign equities. Within equities, consider a value approach. Within and across asset classes, consider using trendfollowing methods to reduce risk and exposure to catastrophic loss.

