I had a great time at the ETF.com (formerly IndexU) conference in Florida the other day. The highlight for me was getting to see Jeremy Siegel speak. He is a brilliant researcher and well deserves the title of the “Wizard of Wharton”. Especially wonderful was he focused his talk on one of my favorite metrics – the Shiller CAPE ratio. (The two are best friends.)
Since I’ve been traveling for the better part of 6 weeks, I had a fun experiment the other day where I offered free subscriptions to The Idea Farm to the individuals that could replicate his NIPA work from his recent paper and Powerpoint presentations. Two proactive analysts build the sheet within two days – pretty cool!
Siegel’s basic argument is that due to accounting changes Shiller’s CAPE is misleading. I actually have no problem with his arguments, they make a lot of sense to me. (Here is a FT article “Don’t put faith in CAPE crusaders“, his white paper here, and Powerpoint here.) I left his book in Colorado but looking forward to reading his recent updated Stocks for the Long Run, a classic.
What I disagree with is his conclusion – (namely he is bullish and argues no overvaluation). Let’s look at his data and see what they say.
The NIPA series basically moves the whole CAPE chart down 3 points. So replicating his data spits out the following chart and numbers:
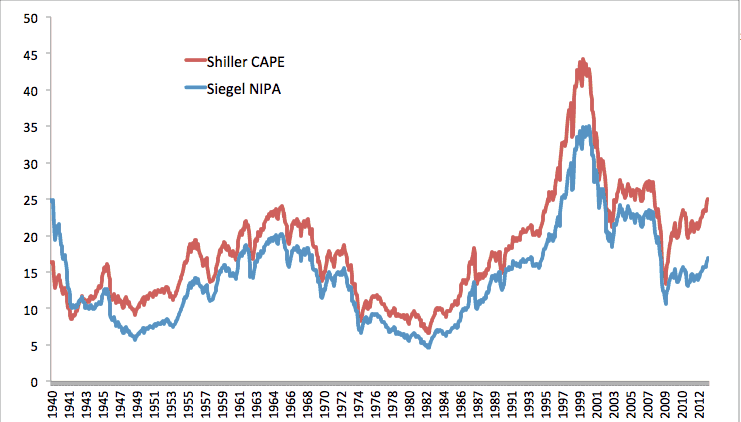
1940 – 2013
Shiller CAPE median valuation: 17
Shiller CAPE current valuation: 25
Over/undervaluation: 47%
Siegel NIPA CAPE median valuation: 14
Siegel NIPA CAPE current valuation: 17
Over/undervaluation: 21%
So, looking JUST at the data, it seems the two best friends should agree…the conclusion is the same, stocks are overvalued, just how much is the question…
