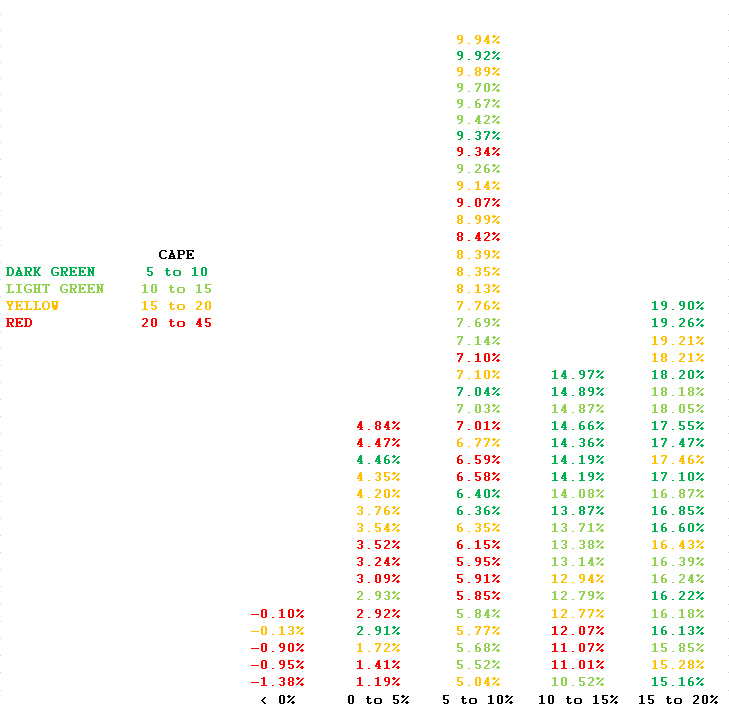
Valuation works over long time periods. In the short term, anything can happen. The US market was slightly expensive at the end of 2012, but lo and behold it returned over 30%. Below is a fun chart of yearly CAPE values back to 1900 and future 1o year returns, and I will keep the commentary light as the conclusions should be fairly self evident. Notice most of the red and yellow years end up on the left side of the chart of low returns, although there are some on the right side. And vice versa with the green ones.
Most investors like to think in binary terms. Stocks are either cheap and a buy, or expensive and a sell (or crash!!!). I’m convinced they think this way along the same lines they like to cheer for sports teams (it’s more fun). I tell investors using valuation is a spectrum of future possibilities. While buying expensive markets generally will produce lower future returns, you will have positive outliers. The same for cheap markets, it’s usually a good idea but they can always get cheaper.