There is a lot of talk about stocks being expensive, but also a lot of people not really doing anything about it. Many simply don’t know how to tackle the problem, and others don’t want to think about it at all. Below, for some perspective, are historical returns to stocks since 1970 and the 10 worst months for the S&P. On average you’re looking at a 11% decline, and that only happens every four years or so (last was Feb 09). Many others have produced charts like this, but I wanted to demonstrate the returns and batting average for typical asset classes when it hits the fan for stocks.
First observation is that when US stocks go down, all stocks go down. It doesn’t matter if you are small cap US, foreign developed or emerging, the high correlation means you all suffer.
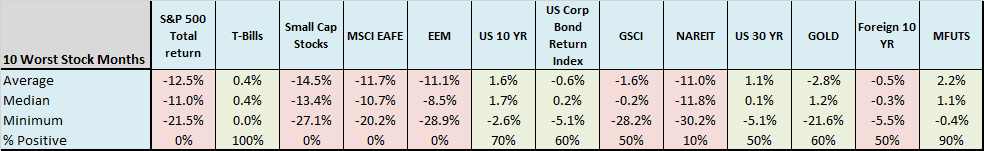
Bonds of all flavors do a good job, but you can only count on them a little more than half the time. Good ol’ 10 year US bonds had the highest median return of any asset during stock drops, However, the lower maturities have a higher hit rate, and of course cash is king with a perfect batting average, but doesn’t do much to diversify and zag when stocks zig.
Commodities are a coin flip, but also had a monster -28% month, so also volatile (ditto for gold). REITs, being stocks, don’t help.
One of the best of course is managed futures (hooray for trend!), but FYI pre-1980s this series is hypothetical. I would argue that this is one of the biggest areas investors are under-allocated. I think having trend strategies as a percentage of a stocks/bonds/real assets portfolio is one of the best diversifiers, and anywhere up to 33% allocation is completely reasonable. I’ve said a number of times that a 1/3 each global stocks, global bonds, and managed futures or trend strategy is really hard to beat. (or do 25% each and add in real assets.) Stay tuned for a future post on the subject.
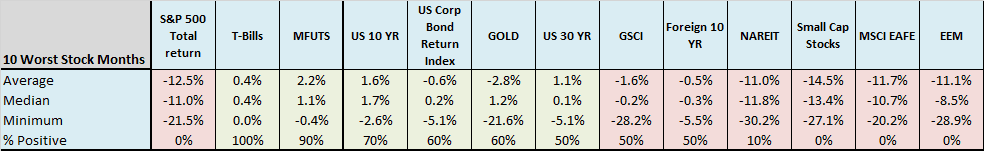
The first figure shows returns of 13 assets when stocks puke. Figure 2 is the same as Figure 1, just sorted by batting average, from good to bad.
Click to enlarge