I enjoyed this interview with Joe Rosenberg of Loews – The Wisdom of a Stock Market Nonconformist. He is a Wall St legend and the interview is great. However, there is a section I disagree with so I thought I would expand my thinking a bit below.
Below is a paragraph from the interview:
Are you bullish?
I’m long-term bullish. Equities over the past 15 years have generated meager returns. To those of us who believe in reversion to the mean, this suggests that the next 15 years will probably offer much higher returns. The trailing 15-year return of the S&P 500 is at an extreme, showing just a 3.8% annualized return, which is even lower than it was in the 15 years that ended with the bear market of 1974. That’s influencing behavior.
I like charts that when you read them the conclusion is immediately obvious. His chart:
Click any chart to enlarge
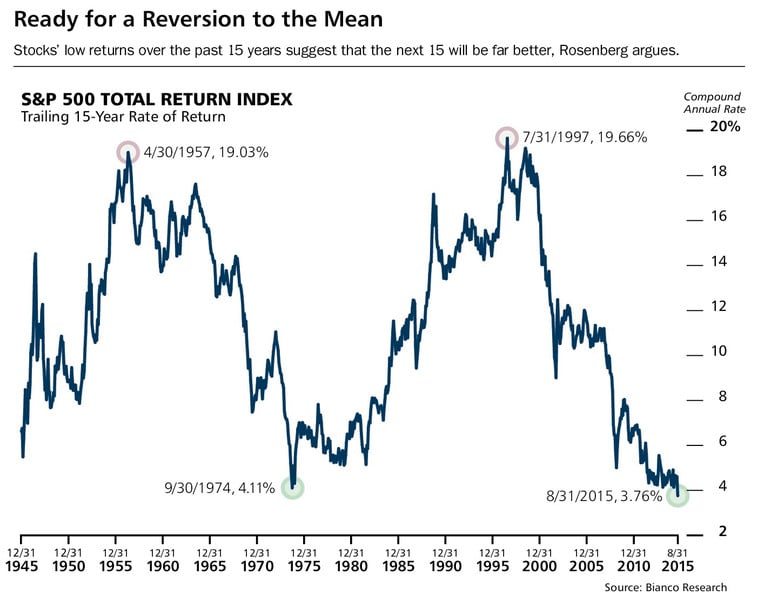
The conclusion and the arguement seem really sound – “stocks have done meh the last 15 years so perhaps it is a great starting point”. Well, being a curious quant I of course went and recreated the chart below back to 1900:
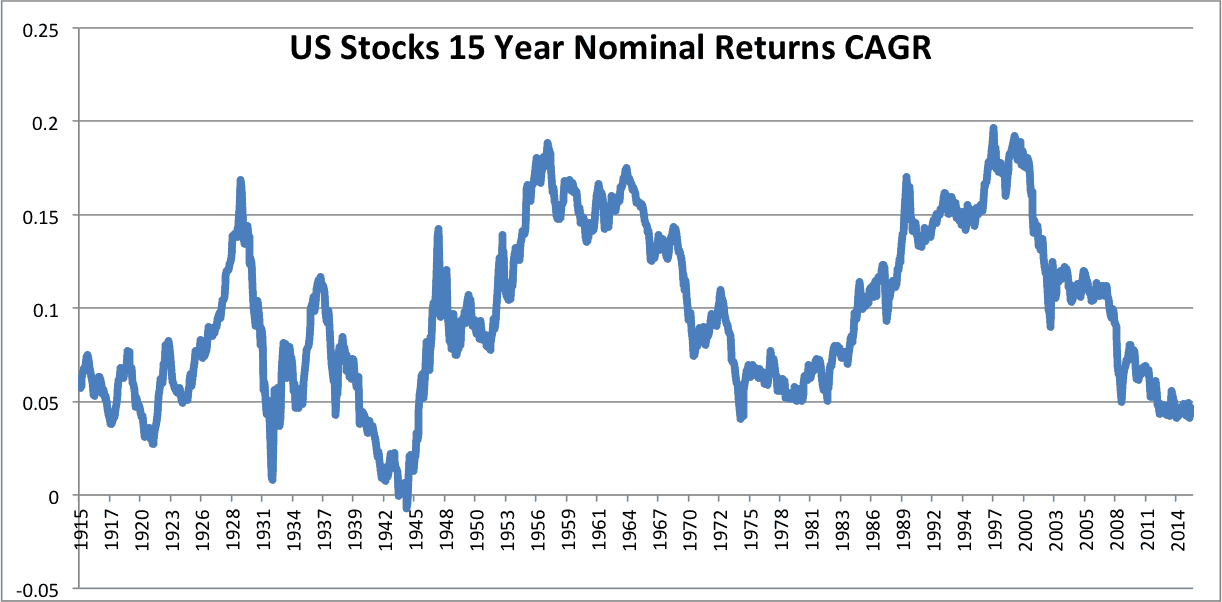
My chart largely agrees with his, but also demonstrates that returns can get worse and certainly did earlier in the 20th century. But, nominal returns are misleading, so we really need to adjust for inflation and below are the real returns:
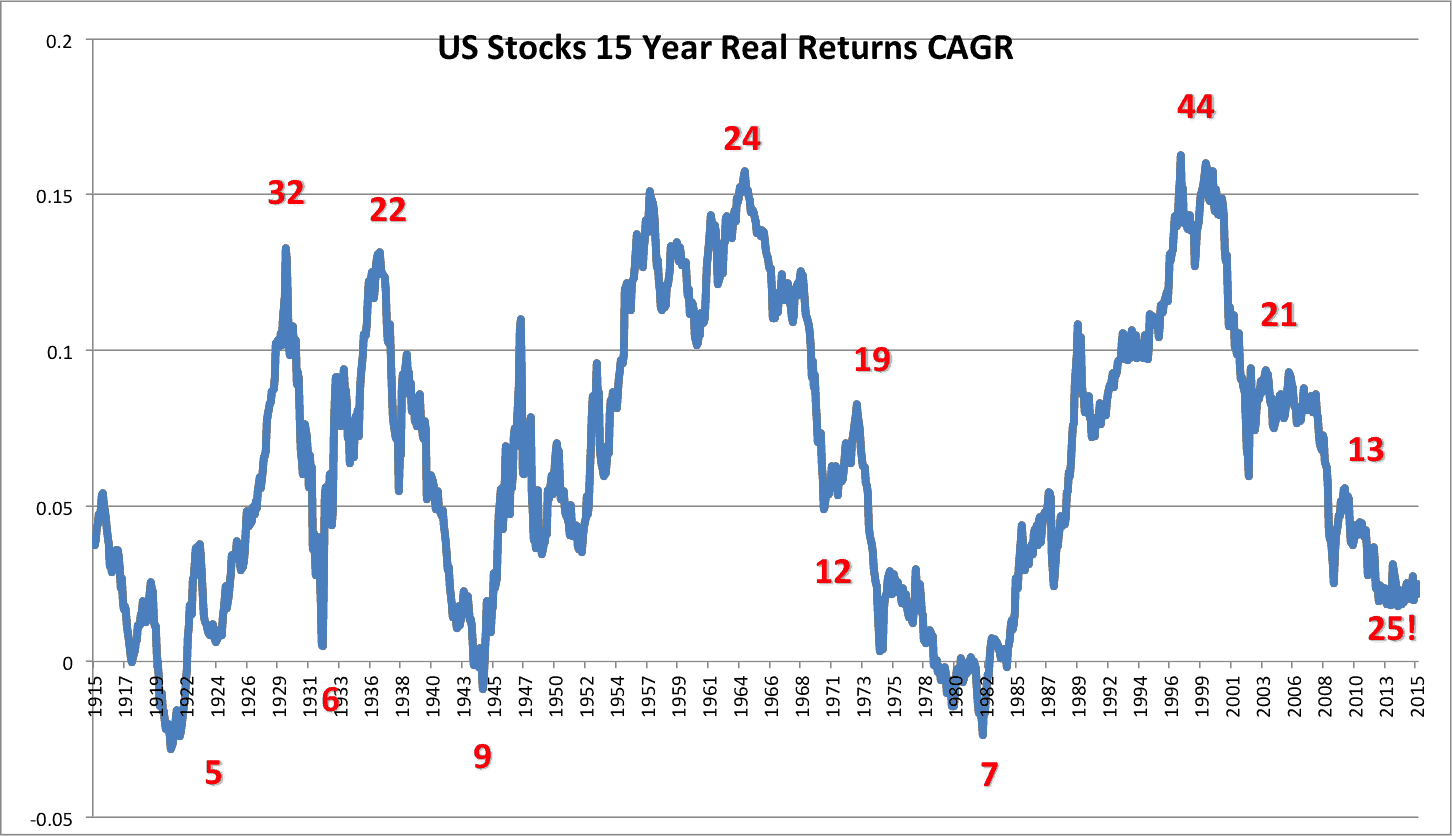
On first glance the chart would offer the same conclusion, namely that stock returns have been sorta weak over the past 15 years and maybe we’re at the start of a great new bull market.
The problem of course is valuation. If you look at the valuations in history for all of the other top and bottom periods, you find what you would expect. We are using the CAPE ratio here but other valuation metrics should work the same. Namely, single digit valuations at the end of bear periods like ’20, ’31, ’42, and 1982. And at market peaks after monster runs you find the opposite – valuations in the 20s, 30s, and 40s. Right now we are at low returns, but those returns are low because we’re coming off the biggest bubble in history in the US for valuations! And the valuations have not declined enough to mark the end of that big bad bear.
As an illustration, take a look at the 1960s – 1980s period. The market peaked at a valuation of 24 (ironically around where we are now) then declined over the ensuing years. When the trailing 15 year real returns reached the current 2015 value of 2.5% in 1974 the CAPE ratio hit a value of 12. Now that probably seems like a good bottom time, right? A low valuation coupled with terrible trailing returns? WRONG. You would have had to wait another EIGHT YEARS for the market to bottom. That would put us today at a potential 2023 date.
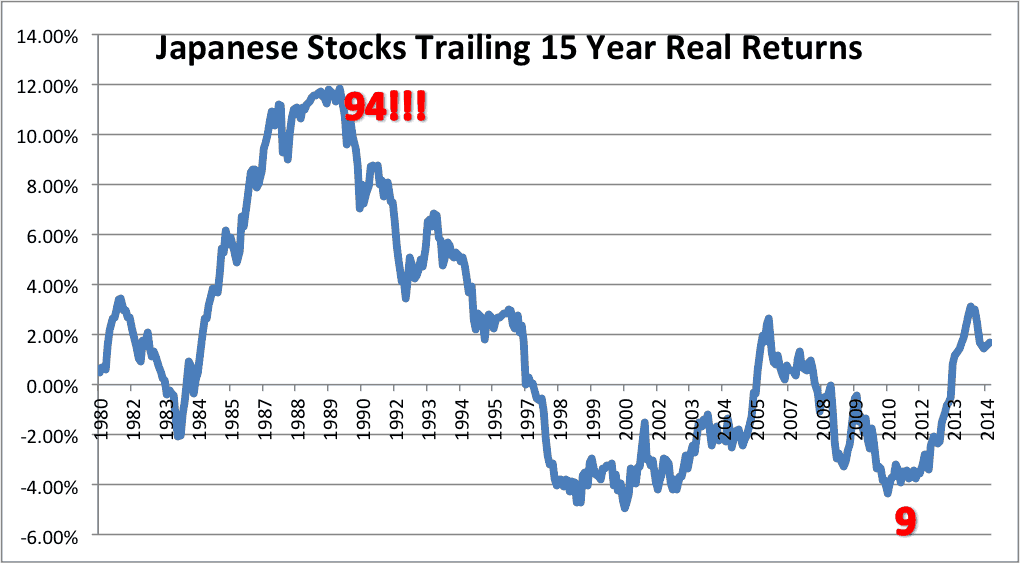
Any time you look at just the US, you are looking at one of the most successful stock markets of the past 115 years. There are approx 45 investable countries now, and examining the history of just one can be misleading. So, below I included an even worse case scenario that isn’t some backwater country – it’s the world’s 3rd largest economy. Of course we’re talking Japan. Notice the big monster bubble followed by the “lost decades” – it takes awhile to work off that excess! When Japanese stocks first crossed that 2.5% real trailing 15 year returns in 1995 (where we are now), realize it took another 15 years for the market to bottom!
So, as you consider waiting around for some mean reversion to happen, first ponder some history, and then take a look at my favorite painting below and ask yourself after 6 up years in stocks, “Is the bear just hiding”?