I was giving a speech this week to the Stansberry group in Las Vegas and was, as always, talking about valuations. Specifically I was talking about Bogle’s simple stock market formula for forecasting future 10 year returns. The example I gave went something like this:
We’re in Las Vegas so let’s use this analogy. Let’s say you can go to the blackjack table, but instead of the normal rules you get to place your bet after the cards have been dealt. If you get dealt a 16 and the dealer has 20, you don’t have to play. Likewise, if you get dealt a 20 while the dealer has a 15, you can place a bet (or not). While this certainly doesn’t guarantee you will win (the dealer could draw a 6 for a 21 for instance), it does increase your odds. That’s why a simple stock market expected returns formula will be of use. It doesn’t guarantee the outcome – but it does give you better expected probabilities. And the best part – is you don’t have to play. Much like the stock market, or any other speculation, you get to choose if you want to play or not.
My old post demonstrated how simple the formula was, and outlined future likely returns (low but positive). Below I thought I’d give a little more color on the full range of possible returns historically, and going forward. This first table demonstrates the three best 10 year return periods for US stocks:
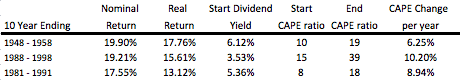
Pretty awesome! In each case you printed money for a decade. But also note the high starting dividend yields and low starting valuations. The CAPE multiple expansion results in additional 6%+ returns per year.
Likewise, check out the worst three 10 year periods:
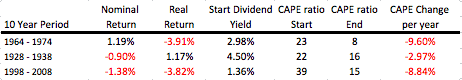
Nasty! You treaded water, or worse, and had to sit through massive 50-80% losses to just get back to even. But also note the lower starting dividend yields and high starting valuations. The CAPE multiple compression results in headwind of negative 3%+ returns per year.
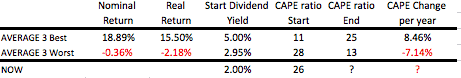
If you look at the averages for reference, you note these similarities. And what series does today more closely resemble?
Lastly, I thought we’d look at the future possible scenarios. We have a 2% starting dividend yield, and I assumed historical 4% growth rates. (Old post used 4.7% but it just depends on what timeframe you look at.) So, the only variable left is where do valuations go?
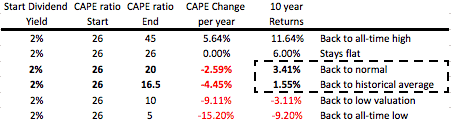
Historical returns in US stocks have been about 9% for reference. So, if we stay at these lofty valuations for 10 years we get 6% returns. If we go back to normal valuations for a low interest rate environment we get to 3.4%. Not good but not as bad as bonds. If we go back to full history normal valuations we get to 1.5%. Similar to treasuries. If we go to low valuations (where many foreign markets are today, well, you can see the red numbers.
Only if CAPE ratio expands can we get back to historical stock market returns. The CAPE ratio has to go up to about 35(!) for us to get to historical stock levels. Even if we go back to the highest bubble levels ever – where Elon Musk invents free energy and we all find out we’re living in a simulation – do we get 11.6% returns. To get to the top level returns from the best 3 table? Need to hit the biggest bubble ever ala Japan and get to a CAPE of 95.
So, US stock returns should be muted, but not negative. The good news? Many foreign markets are sitting on 3-5% dividend yields and CAPE ratios of 8-15. The equation works much better for those markets and we do expect double digit returns there.
Remember, just like the blackjack analogy, you get to choose what markets you want to invest in. You don’t have to accept these probabilities if you don’t want to.
So, do you want to play?
