In his recent column, “Reports of it’s Demise Were Premature“, Mark Hulbert examines the historical track record of the 39-week moving average:
The study was conducted by Ned Davis Research for Israel-based Psagot Mutual Funds, which shared the study with me. The study encompassed the period from late 1979 and until last week, over which time buying and holding the S&P 500 index produced a 10.2% annualized return.
In contrast, a strategy that switched between the S&P 500 and commercial paper according to whether the S&P 500 was above or below its 200-day moving average produced an 11% annualized return. And not only did the strategy market more money than buying and holding, it did so while being significantly less risky than the overall market. That’s a winning combination.
(The 39-week moving average is basically the same as the 10-month moving average used in my paper. )
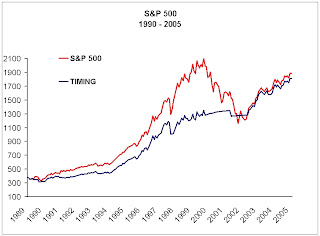
Below is a chart of the strategy vs. buy and hold from 1990 – 2005, and as you can see, it lagged the market for the bull market, but also sat out the bear market in cash:
One of the key take-aways from my paper is that utilizing a moving average strategy is a risk-reduction technique, not a return enhancing one. Many people emailed in commenting that the lagging performance of the strategy during the 1990’s was evidence that the strategy was broken, possibly due to too many people following it. That is missing the point – buy-and-hold is the best strategy during a raging bull market(excluding leverage). But if you know a bull market is coming then you would be buying call options or futures and probably living in Costa Rica at this point.
Many people do not find the strategy that attractive since it merely reduces risk rather than “beating the market”. In fact, the timing strategy only beats the market around 50-60% of the time. The timing strategy would have underperformed in 4 of 10 years of the 1990’s.
However, by reducing the volatility of an asset class, then combining a number of asset classes into a portfolio, the results can be staggering. A diverse portfolio of assets utilizing the timing strategy results in similar returns as stocks, but with approximately one-third of the risk as measured by drawdown and volatility. Leveraging that portfolio results in > 50% increases in returns, STILL with less risk than stocks. Below are two charts (log, non-log) from the paper that detail the results (the second looks like one you would find in the back of a trading magazine touting uranium stocks or the like).
An initial investment of $10,000 at the beginning of 1972 would be worth almost $500,000 while an investment in the leveraged strategy would be worth almost $2M. . .(and that number is conservative as I used the broker call rate for leverage).

Leave a comment if you have any questions, or would like to see any sub-period charts from any of the asset classes mentioned in my paper. . .


