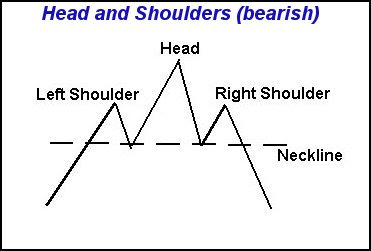
One of the most popular technical patterns that chartists follow is the head and shoulders pattern. The definition from Investopedia:
1. Rises to a peak and subsequently declines.
2. Then, the price rises above the former peak and again declines.
3. And finally, rises again, but not to the second peak, and declines once more.The first and third peaks are shoulders, and the second peak forms the head.
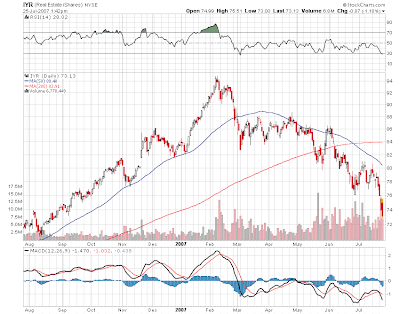
I don’t know if IYR exactly qualifies, but it looks like a head and shoulders to my untrained eyes (chart from Stockcharts.com). Neckline at 82?
However, does the head and shoulders pattern even work?
The below is from the good folks at AlphaLetters Journal reviews:
Category: Head-and-Shoulders, technical analysis
Title: The Predictive Power of Head-and-Shoulders” Price Patterns in the U.S. StockMarket
Author: Savin, Gene; Weller, Paul; Zvingelis, Janis
Source: Journal of Financial Econometrics, Volume 5, Number 2, 2007 , pp. 243-265(23)
Link: http://technicalanalysis.org.uk/reversal-patterns/SaWZ03.pdf
Abstract: We use the pattern recognition algorithm of Lo, Mamaysky, and Wang (2000) with some modifications to determine whether “head-and-shoulders” (HS) price patterns have predictive power for future stock returns. The modifications include the use of filters based on typical price patterns identified by a technical analyst. With data from the S&P 500 and the Russell 2000 over the period 1990-1999 we find little or no support for the profitability of a stand-alone trading strategy. But we do find strong evidence that the pattern had power to predict excess returns. Risk-adjusted excess returns to a trading strategy conditioned on “head-and-shoulders” price patterns are 5-7% per year. Combining the strategy with the market portfolio produces a significant increase in excess return for a fixed level of risk exposure.


