Investors seem to have a love hate relationship with commodities.
Not me – long time readers know that I am a big fan of both commodities and managed futures. Three months ago I wrote an article on managed futures and how Renaissance was planning on launching a $25 billion fund. Recently, Morningstar announced some new commodity indexes, and I thought I would take a look under the hood.
[This is also a great example of a former alpha source becoming commoditized and repackaged as alternative beta at a much lower cost. If I ran a CTA/CPO, or was considering becoming a long term trendfollowing CTA, I would focus on a system that has zero or negative correlation to the long term trendfollowers (which the vast majority of CTAs are). Take note highly compensated “alpha” managers everywhere, your jobs are in danger!]
I spent the better part of yesterday trying to figure out how Morningstar came up with some of their numbers in the Indexes 2007 PDF. Turns out some of the text was incorrect. (In their defense it was an honest editing mistake, but this is not always the case.)
Here are links to their corrected papers:
Morningstar Commodity Indexes Fact Sheet
Comparison of Commodity Indexes
The Next Generation of Commodity Indexes
Construction Rules for Morningstar Commodity Indexes
and here is their YTD performance.
I am going to link to some good excerpts and add my comments.
Long-only commodity futures strategies often prove inadequate in providing exposure to commodities per se. Unlike stock shares, which have a net positive supply, commodity futures (as opposed to the underlying commodities) have a net supply of zero. Someone is short a commodity futures contract for every long one. This relationship among various players in the futures market can create situations in which long-only strategies may fail to generate consistent risk premiums, even in commodity bull markets. Professional Commodity Trading Advisors (CTAs) tend to take both long and short positions in commodity futures, often based on current trends in prices.
They then go into the drivers of commodity returns, which I touched on in the previous post:
A futures strategy generates excess return (i.e., return in excess
of the risk-free rate) from two sources:
– Changes in futures prices
– The roll yield—which can be either positive or negative – that results from replacing an expiring contract with a further out contract in order to avoid physical delivery yet maintain positions in the futures markets
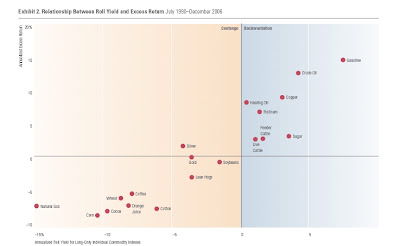
Here is a good chart showing the relationship between roll yield and excess return:
(I would add any benefit from reblancing as well.)
They created the following indexes:
– Long/Short – always long or short for every commodity
– Long-only—always long for every commodity
– Long/flat—same long and flat positions as the Long/Short
index and replaces the short positions with flat positions
– Short/flat—same short positions as the Long/Short index
and replaces long positions with flat positions
– Short-only—always short for every commodity
The indexes are reconstituted annually and rebalanced monthly.
They fully disclosure their method (another plus), using the 12-month moving average. Although for some reason they take the same view on energy futures as S&P(they don’t go short because they would have affected the backtested results too much obviously). I disagree of course.
An exception is made for commodities in the energy sector. If the signal for a commodity in the energy sector is short, the weight of that commodity is moved into cash; that is, we take a flat position. Energy is unique in that its price is extremely sensitive to geopolitical events and not necessarily driven purely by demand-supply imbalances.
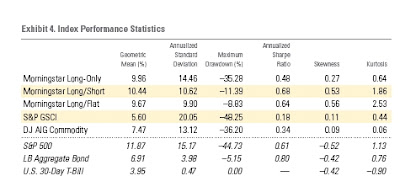
How about historical performance? Here are the results since 1991 (since that is when the DJ AIG Commodity Index started). (Although I would have rather Morningstar excluded the DJ AIG index and showed results back to 1972.) Note: They have emailed me the backtested results since 1980 and I will take a look at them in a future post.
Take a look at the long only vs. the long flat. The relative results are very similar to my timing paper. Namely, a trendfollowing approach achieves similar returns as buy and hold, reduces volatility by ~30%, and reduces drawdown by about half (although in this case it is more like 75%).
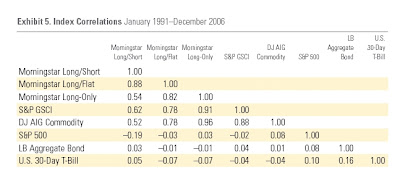
The correlation of long-only to long/flat is similar to my timing paper at around 0.82. The long-only and popular commodity indexes are very highly correlated (over .9). Notice that the correlation of Long/Short to GSCI is less at 0.62, which is why I use both in asset allocation portfolios.
I really like these indexes, and Barclays if you are listening hurry up and license these indexes (at a low cost please, how about 50 bps?).
Some symbols of commodity ETFs and a managed futures mutual fund:
iShares GSCI Commodity-Indexed Trust ETF (GSG)
iPath Dow Jones-AIG Commodity Index Total Return ETN (DJP)
iPath S&P GSCI Total Return Index ETN (GSP)
PowerShares DB Commodity Index Tracking Fund ETF (DBC)
PowerShares DB Agriculture Fund ETF (DBA)
Rydex Managed Futures (RYMFX)


