I should snicker, to sneeze, to smile, to stoop and kiss a grasshopper, and slobber in a coal bucket and see a son of a sea terrapin stick his head through the barbed wire fence backwards and cut off his tail in the slop barrel.
Did the above not make any sense? How about this one:
One a zog, two a zog, zig zag zain. A bob tailed nanny goat, tickle tog tain. Harem, scarem, sinctum, sanctum, rhythm, rathem, buck.
Still not making sense? It shouldn’t – they are nonsensical poems my grandmother taught all of the kids when we were growing up in North Carolina. It mainly kept us busy during family vacations to the beach. She would give us $1 when we got it right. What does this have to do with investing?
Noise.
You hear it all day on CNBC, the WSJ, blogs, and in the lockeroom. Gold up! Stocks down on profit taking! Bear Stearns goes under! Buy low P/E stocks! etc etc. It is dangerous to your wealth to listen and act on most of this info, and does not aid in the portfolio management process whatsoever. All of the behavioral evidence goes to show that it works to hurt your returns. Even worse, the comments are often misleading and even completely wrong.
Take this cliche for example: “Market timing is a fools game. As an example, look what would happen if the investor missed the 10 best days in the market.”
I HATE HATE HATE this comment. I can’t tell you how many times I have seen this on a PowerPoint slide to justify buy and hold.
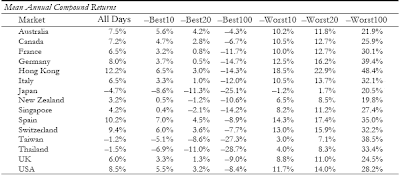
Most pundits fail to mention what would happen if you missed the ten worst days as well. There are some people that have examined the effects of missing the top 10 worst days and top 10 best days. A good example is from CXO who posts a review of the paper “Black Swans and Market Timing: How Not to Generate Alpha“. From the abstract:
The evidence from 15 international equity markets and over 160,000 daily returns indicates that a few outliers have a massive impact on long term performance. On average across all 15 markets, missing the best 10 days resulted in portfolios 50.8% less valuable than a passive investment; and avoiding the worst 10 days resulted in portfolios 150.4% more valuable than a passive investment. Given that 10 days represent less than 0.1% of the days considered in the average market, the odds against successful market timing are staggering.
The author does a great job on the paper, although comes to the unfortunate conclusion that it is impossible to predict when these rare bad months will occur. I agree it is very hard to predict, but a simple timing model can help protect you nonetheless.
Richard Ahrens takes up the topic with his “Missing the 10 Best Days” pdf. He finds that most of the best days are followed by some of the worst days/declines. He comes to the following conclusion:
The best days in the market are nothing more than interesting statistical anomalies. The argument that missing the best days would reduce the final return of a buy-and-hold investment is true, but it also provides no information regarding the question of whether or not one can time the market. A simple moving average cross-over system will cause you to miss nearly every one of the best days and you should be happy to watch them pass by, because you’ll also be missing the more-than-offsetting declines those “best” days are invariably tied to.
Paul Gire shares my sentiments. He had a GREAT piece in the Financial Planning Journal here. He goes as far as to state that using this market statistic is possibly an ethical violation!
For years Wall Street and the mutual fund industry have advanced the concept that investors should buy and hold. A common piece of evidence to support this recommendation is various versions of “Don’t Miss the Ten Best,” which show that missing just a small percentage of the market’s best days dramatically reduces investor returns.
A closer look reveals that all may not be as it first appears, that this may be a misleading characterization of market history. If so, “Don’t Miss the Ten Best” could be construed as an ethical violation of both the CFP Board’s Code of Ethics and Professional Responsibility (Code of Ethics), and the Securities and Exchange Commission’s Rule 206(4)-1 under the Investment Advisers Act of 1940.
In light of these findings, advisors may want to consider either refraining from future reference to such studies, or add an additional disclaimer.
Here is a table from the article:
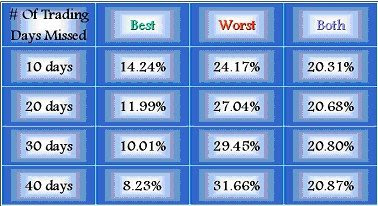
I decided to run another study. I was concerned that the previous data, dominated as it was by the singular event of the 1929 crash, may have skewed my findings. So I tried to achieve a more balanced view by examining one of the most bullish periods in Dow history, from 1984 to 1998. In addition, I examined the impact from missing not just the 10 best and worst days—I also examined the 20, 30, and 40 best and worst days. Here’s what I found:
* The buy-and-hold return for this 15-year period was 17.89 percent—one of the most bullish periods in market history.
He states:
* In the majority of cases, large percentage gainers were no more than 90 trading days away from a large percentage loser, sometimes before and sometimes after.
* One exception was the large one-day gain on September 5, 1935, in which there was no large losing day associated with it.
* In 50 percent of the cases, gainers and losers were separated by no more than 12 trading days.
* When looking at Nasdaq’s 20 largest gainers and losers (not shown) of the 20 largest one-day gains, all but two of them occurred during the bear market of 2000–02, when the Nasdaq crashed 78 percent.Not only does missing both result in superior returns—imagine the knock-off benefits from lower volatility, especially on client psychology. As many advisors have learned since the 2000–02 bear market, it’s one thing to encourage clients to stay the course when markets are trending steadily higher, quite another when bear markets rapidly erode the gains from years of careful saving and investing. In 30 months the 2000–02 bear market erased half of the market gains of the previous 26 years—since 1974.


